The Russian invasion of Ukraine has been a wake-up call for much of Europe. Here in the United States, we understand World War is a possibility, but
LGBTQ+ Disneygoers Spend Millions at Disney
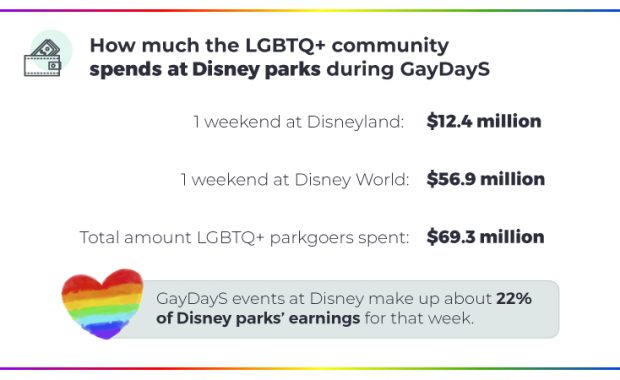
LGBTQ+ Disneygoers spend over $60 million at Disney World in one weekend Each year, around 180,000 members of the LGBTQ+ community come together at
Child Support by Court Order: How It Works
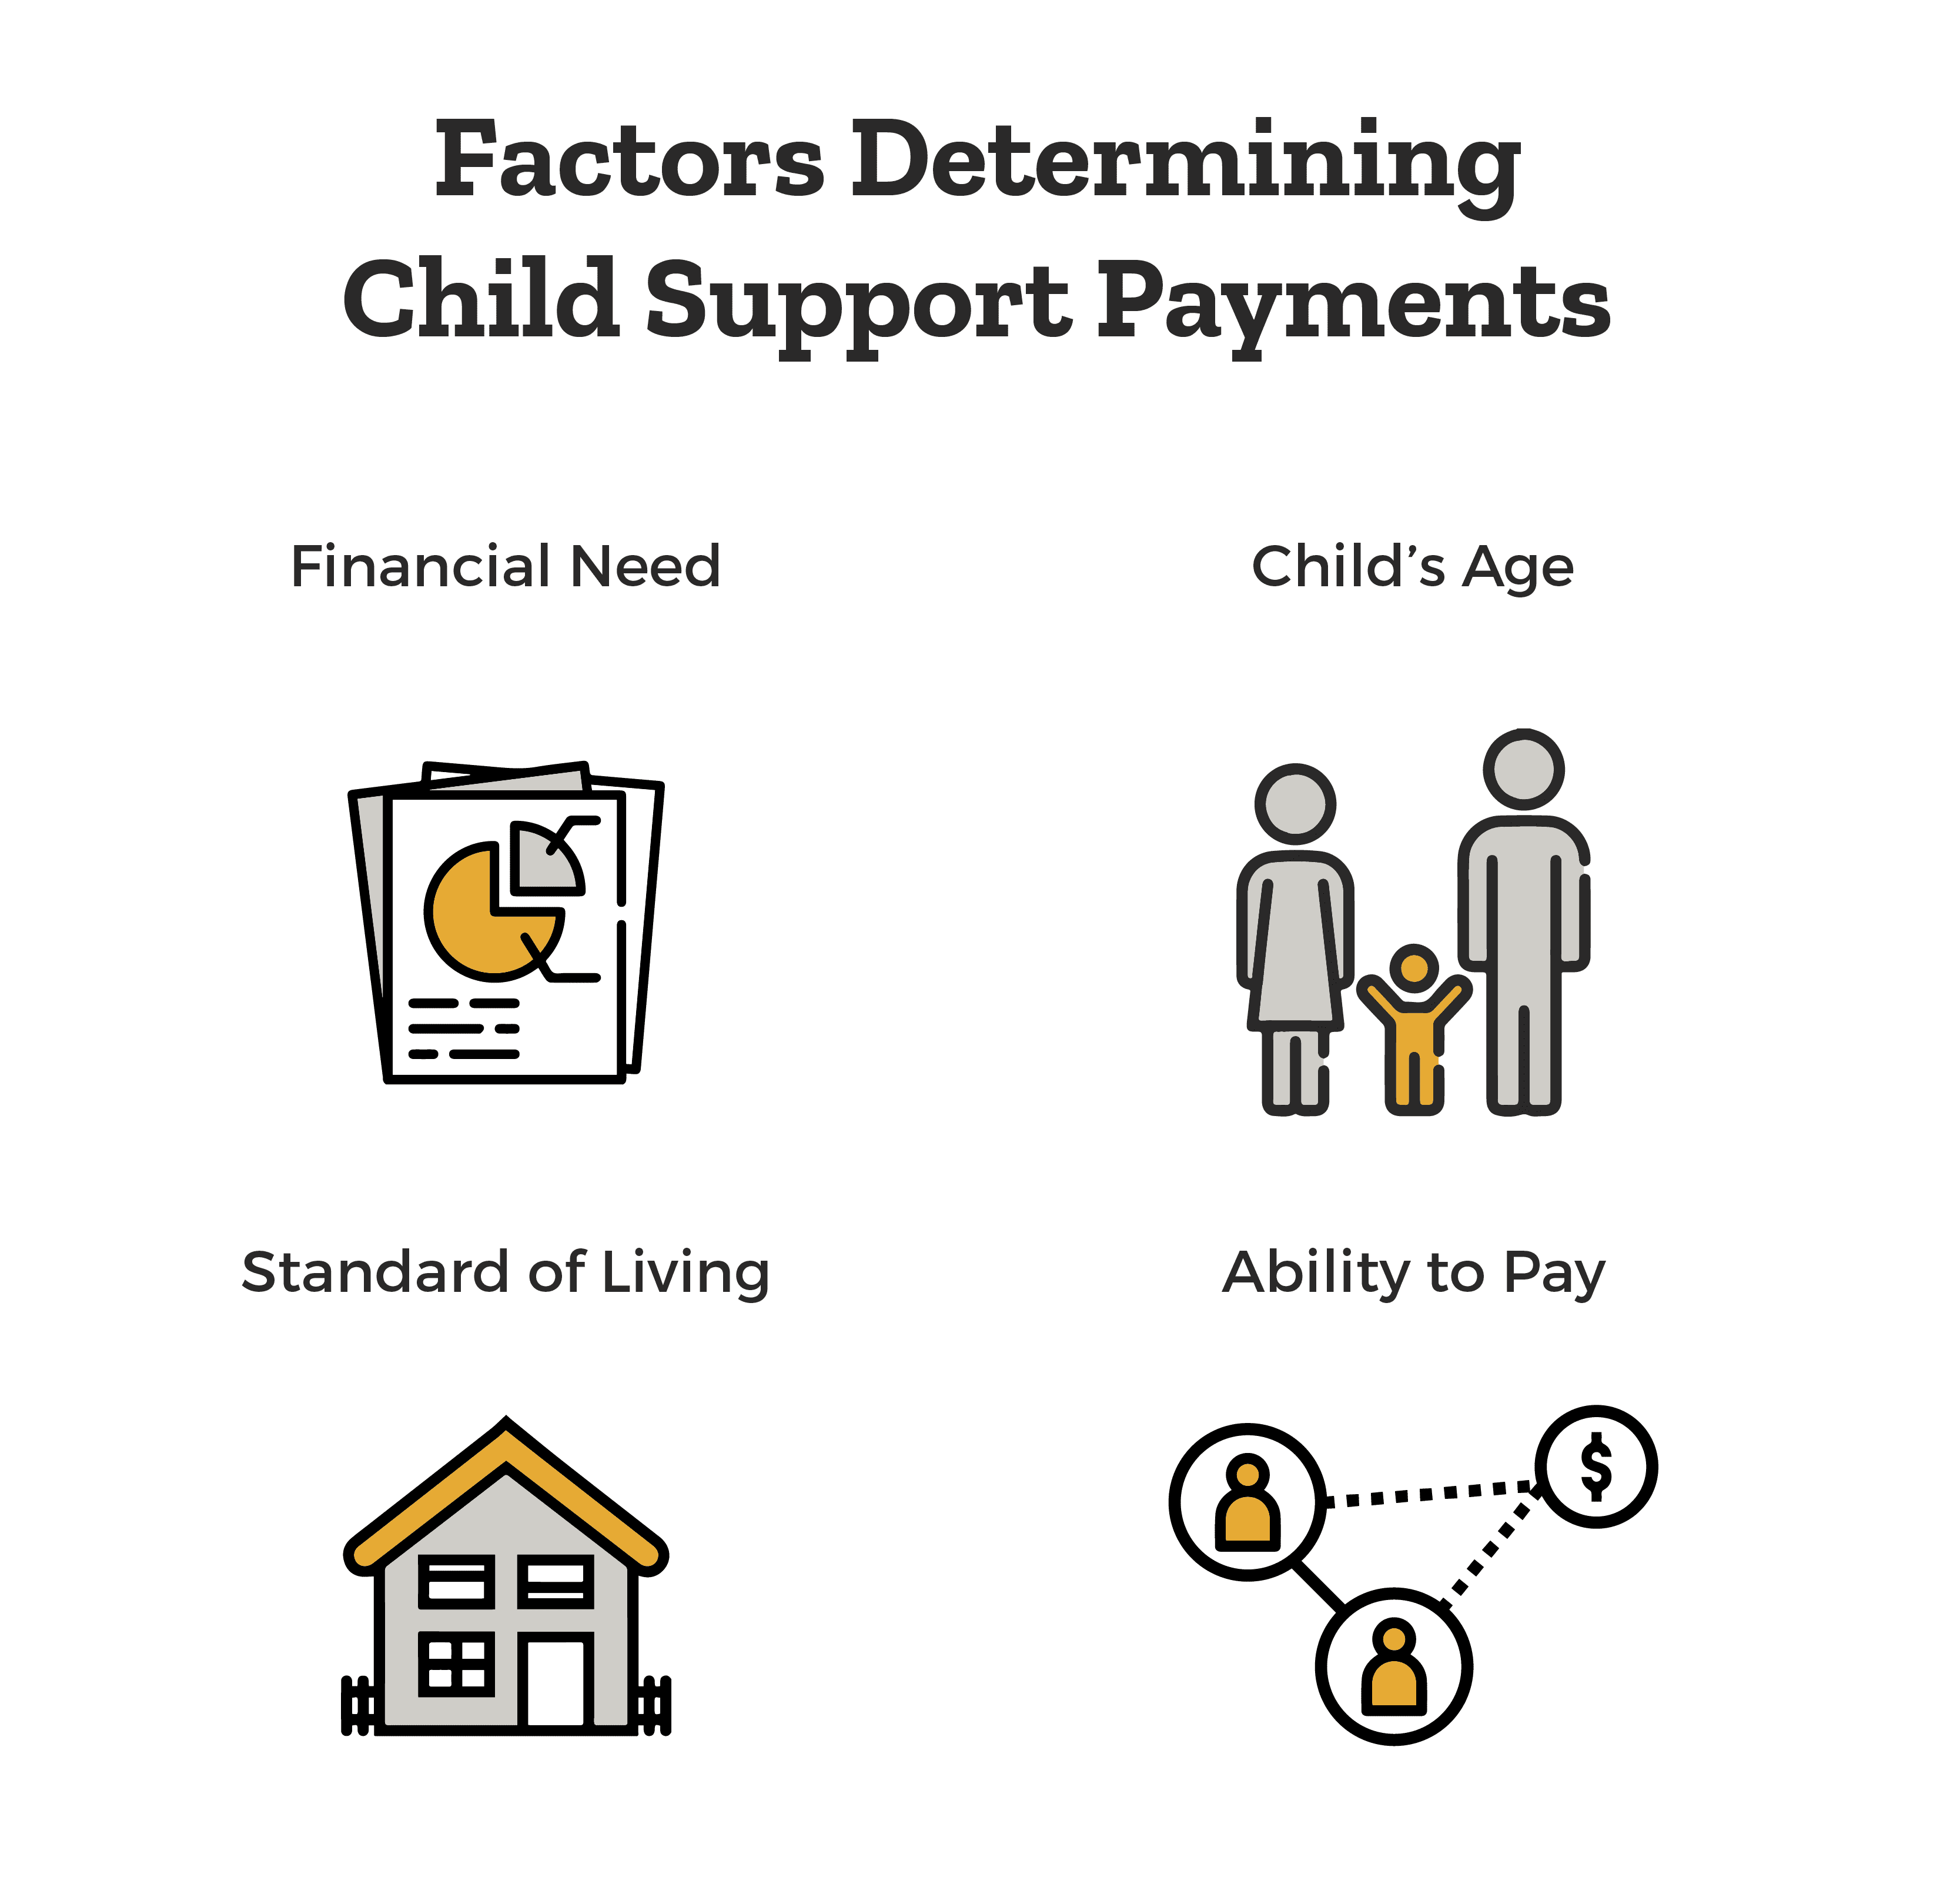
What Is A Child Support Order? Both parents have a legal responsibility to support their children financially. For child support, the noncustodial
How Joint Child Custody Works
What Is The 4-3/3-4 Child Custody Schedule? Popular schedules include the “4-3/3-4 schedule” in which the child is with “parent A” for four days,
Censorship at Work
Around half of all employees say it’s OK for their employers to monitor work chats We surveyed 1,156 professionals, from employees to business
What to Do When You Can’t Pay the Rent
Millions of tenants, out of work and financially strapped due to the coronavirus pandemic, have enjoyed a temporary reprieve from homelessness as a
President Trump’s Coronavirus Statements Compared To Cases and Deaths Over Time
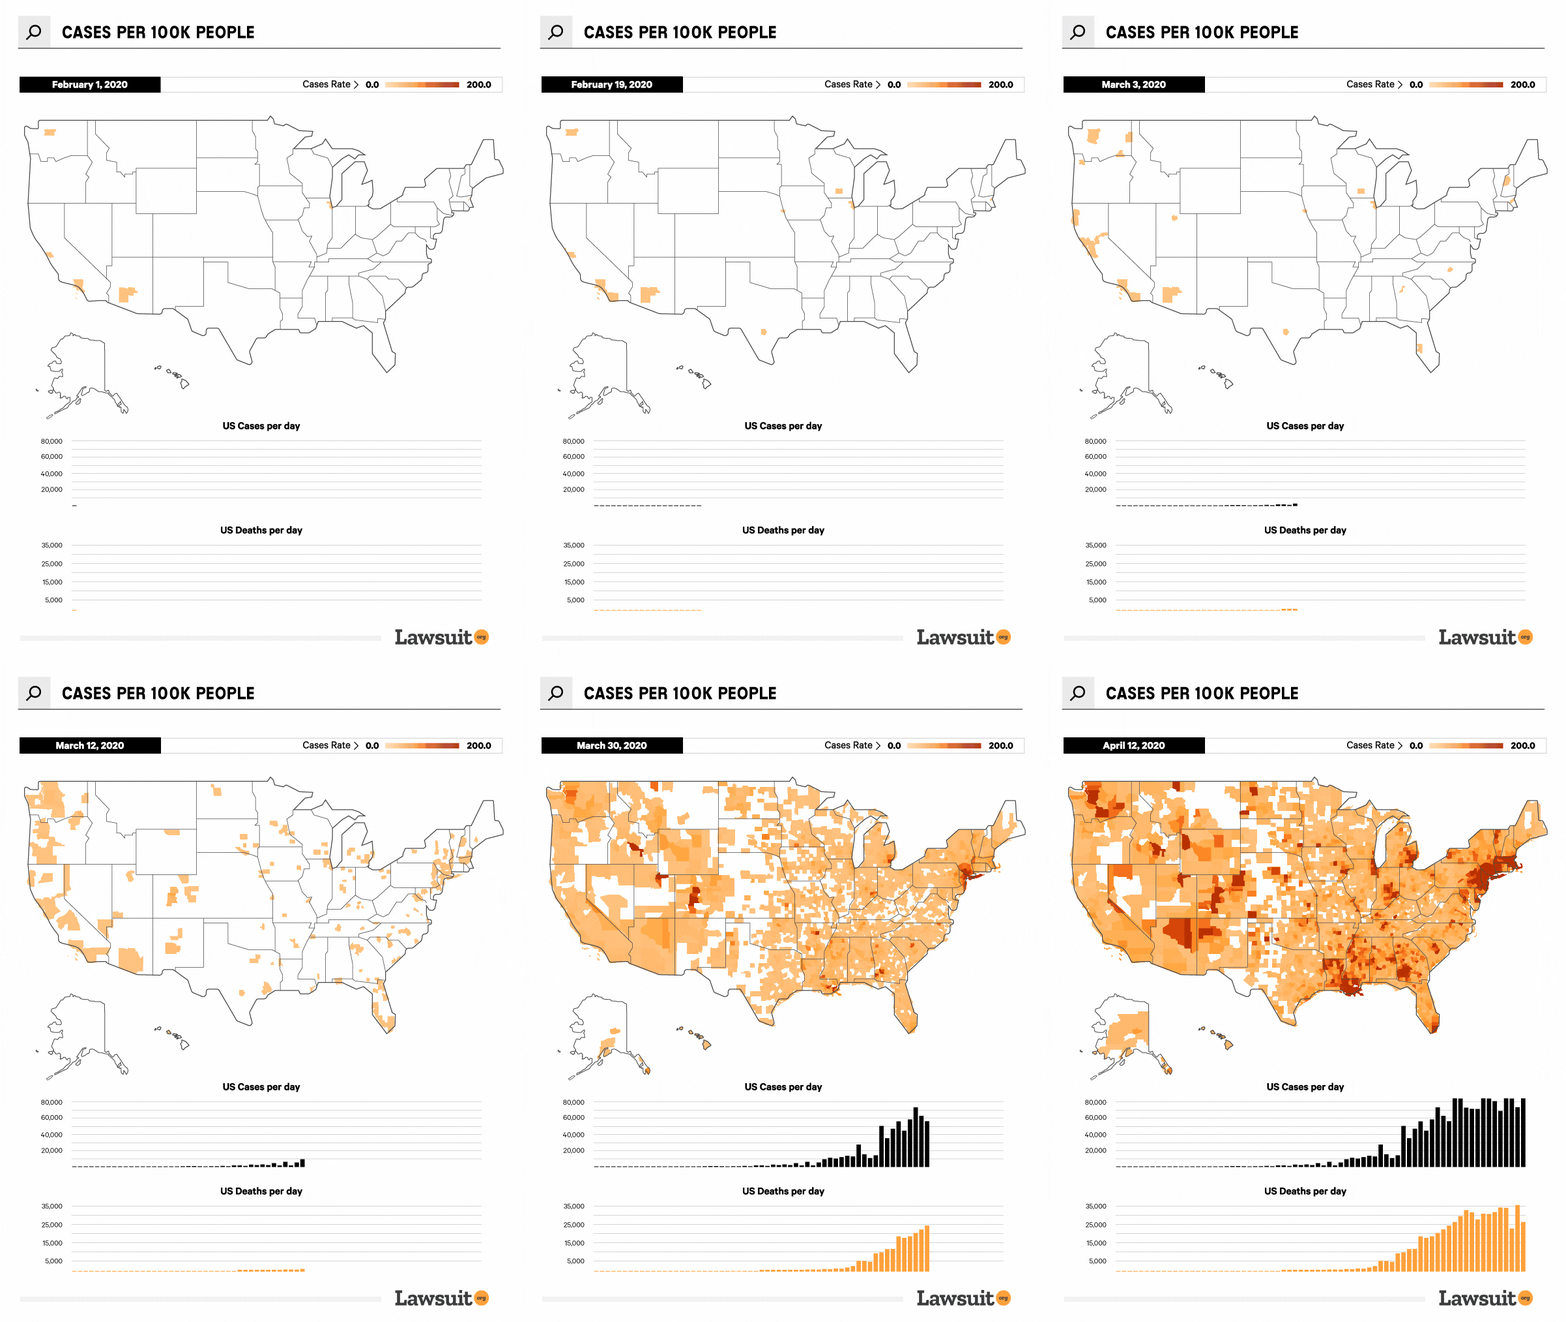
Using New York Times COVID-19 data, we created an animated map to show growth and spread of the Coronavirus pandemic in the United States. We
Visualizing “Stay at Home” Compliance Over Time – USA Worse Than Most – From Apple’s Mobility Data
The below chart was created using data from Apple's Mobility Trends Report. The charts show a relative volume of change in driving behavior by
US “Failing Miserably” at staying home during Covid19 – Ranks 85 out of 128 Countries
Using this script, we scraped Country level data from Google's Google's COVID-19 Community Mobility Reports in order to map the change in dwell time


