Predictive Policing in the Modern Era
Want to contribute to a larger project to collect this data from many more counties? https://www.reddit.com/r/DataPolice/wiki/how_to_contribute
In the 2002 dystopian sci-fi film “Minority Report,” law enforcement can manage crime by “predicting” illegal behavior before it happens. While fiction, the plot is intriguing and contributes to the conversation on advanced crime-fighting technology. However, today’s world may not be far off.
Data’s role in our lives and more accessibility to artificial intelligence is changing the way we approach topics such as research, real estate, and law enforcement. In fact, recent investigative reporting has shown that “dozens of [American] cities” are now experimenting with predictive policing technology.
Despite the current controversy surrounding predictive policing, it seems to be a growing trend that has been met with little real resistance. We may be closer to policing that mirrors the frightening depictions in “Minority Report” than we ever thought possible.
Fighting Fire With Fire
In its current state, predictive policing is defined as:
“The usage of mathematical, predictive analytics, and other analytical techniques in law enforcement to identify potential criminal activity. Predictive policing methods fall into four general categories: methods for predicting crimes, methods for predicting offenders, methods for predicting perpetrators’ identities, and methods for predicting victims of crime.”
While it might not be possible to prevent predictive policing from being employed by the criminal justice system, perhaps there are ways we can create a more level playing field: One where the powers of big data analysis aren’t just used to predict crime, but also are used to police law enforcement themselves.
Below, we’ve provided a detailed breakdown of what this potential reality could look like when applied to one South Florida county’s public databases, along with information on how citizens and communities can use public data to better understand the behaviors of local law enforcement and even individual police officers.
Not-So-Public Public Records
Thankfully, we have decently robust laws and regulations regarding the public’s right to data collected by federal, state, and local agencies, including policing data. While the laws do vary somewhat state to state, nearly every county in the United States provides some mechanism for requesting or digitally obtaining police activity data. Arrests, citations, trends, and sometimes officer complaint information is available.
The problem, however, is that while this data is “available,” that is very different from being “easily accessible.” More often than not, granular police officer-level data is not possible to gather digitally from county public record tools, or you must request this data directly, sometimes waiting many months to be sent the data after submitting a FOIA request.
This leads to a situation where the letter of the law is met, but the spirit of the law (the ability for the public to have real access) is not.
Citizen Coders and Data Investigators Unite!
The key to leveling the playing field lies in either forcing police data accessibility through legislation (mandating a standard way of making all records easily accessible) – which seems unlikely to happen in the near future – or strengthening a citizen-led effort to find, scrape, collate, and formalize county-level police data collaboratively.
This creates an environment where information is not just available but truly accessible through transparent means.
Deep-Dive Analysis of One Florida County’s Citation Statistics
Palm Beach County, Florida, is an excellent example of where policing data is public, but gathering enough data to do any deep analysis is typically impossible without writing code to scrape records one by one.
The county’s public portal has no options for bulk downloading or mass exporting of data, so because of this, investigating the behaviors of individual police officers or even whole departments is nearly impossible. To do so means individually downloading and collating tens of thousands of records. Without writing software to do this, it cannot be done in any reasonable time frame.
So we did just that.
With our development team, we wrote a custom scraping tool to iterate through all of the public records available via the Palm Beach County court records search tool provided on its website.
Doing so required writing complex code that could accurately grab the records and avoid the rate-limiting mechanisms. The code we used for this scrape is could very likely be adapted for use with public record search tools used by other counties.
Developing and sharing county record scraping code is one extremely effective way to create a national repository of county-level police activity and, in our opinion, is a very worthy endeavor for anyone with such a skill set.
Palm Beach County Traffic Citations and Race
Racism in policing is among the most disturbing trends in law enforcement. The widely controversial and damaging “stop and frisk” policy is an example where vague terminology led to varying interpretations of what a “reasonable stop” meant, allowing officers to exercise their prejudice across a wide variety of jurisdictions.
More somberly, shootings involving white police officers and black suspects result in highly contentious skirmishes between local populations and police departments. It’s not enough to address racial bias after the fact when it is too late to prevent fatal incidents from taking place.
Armed with county-level policing data, the public can view the actions, trends, arrest and citation records, and more in relation to how each officer spends their resources. Unfortunately, these findings indicate disparities in how officers treat others based on their race, gender, and more.
By leveraging county-level data, it is possible to find officers who are exhibiting behaviors that could indicate a strong racial bias.
Traffic Citation Race/Ethnicity Distribution in Palm Beach County, FL
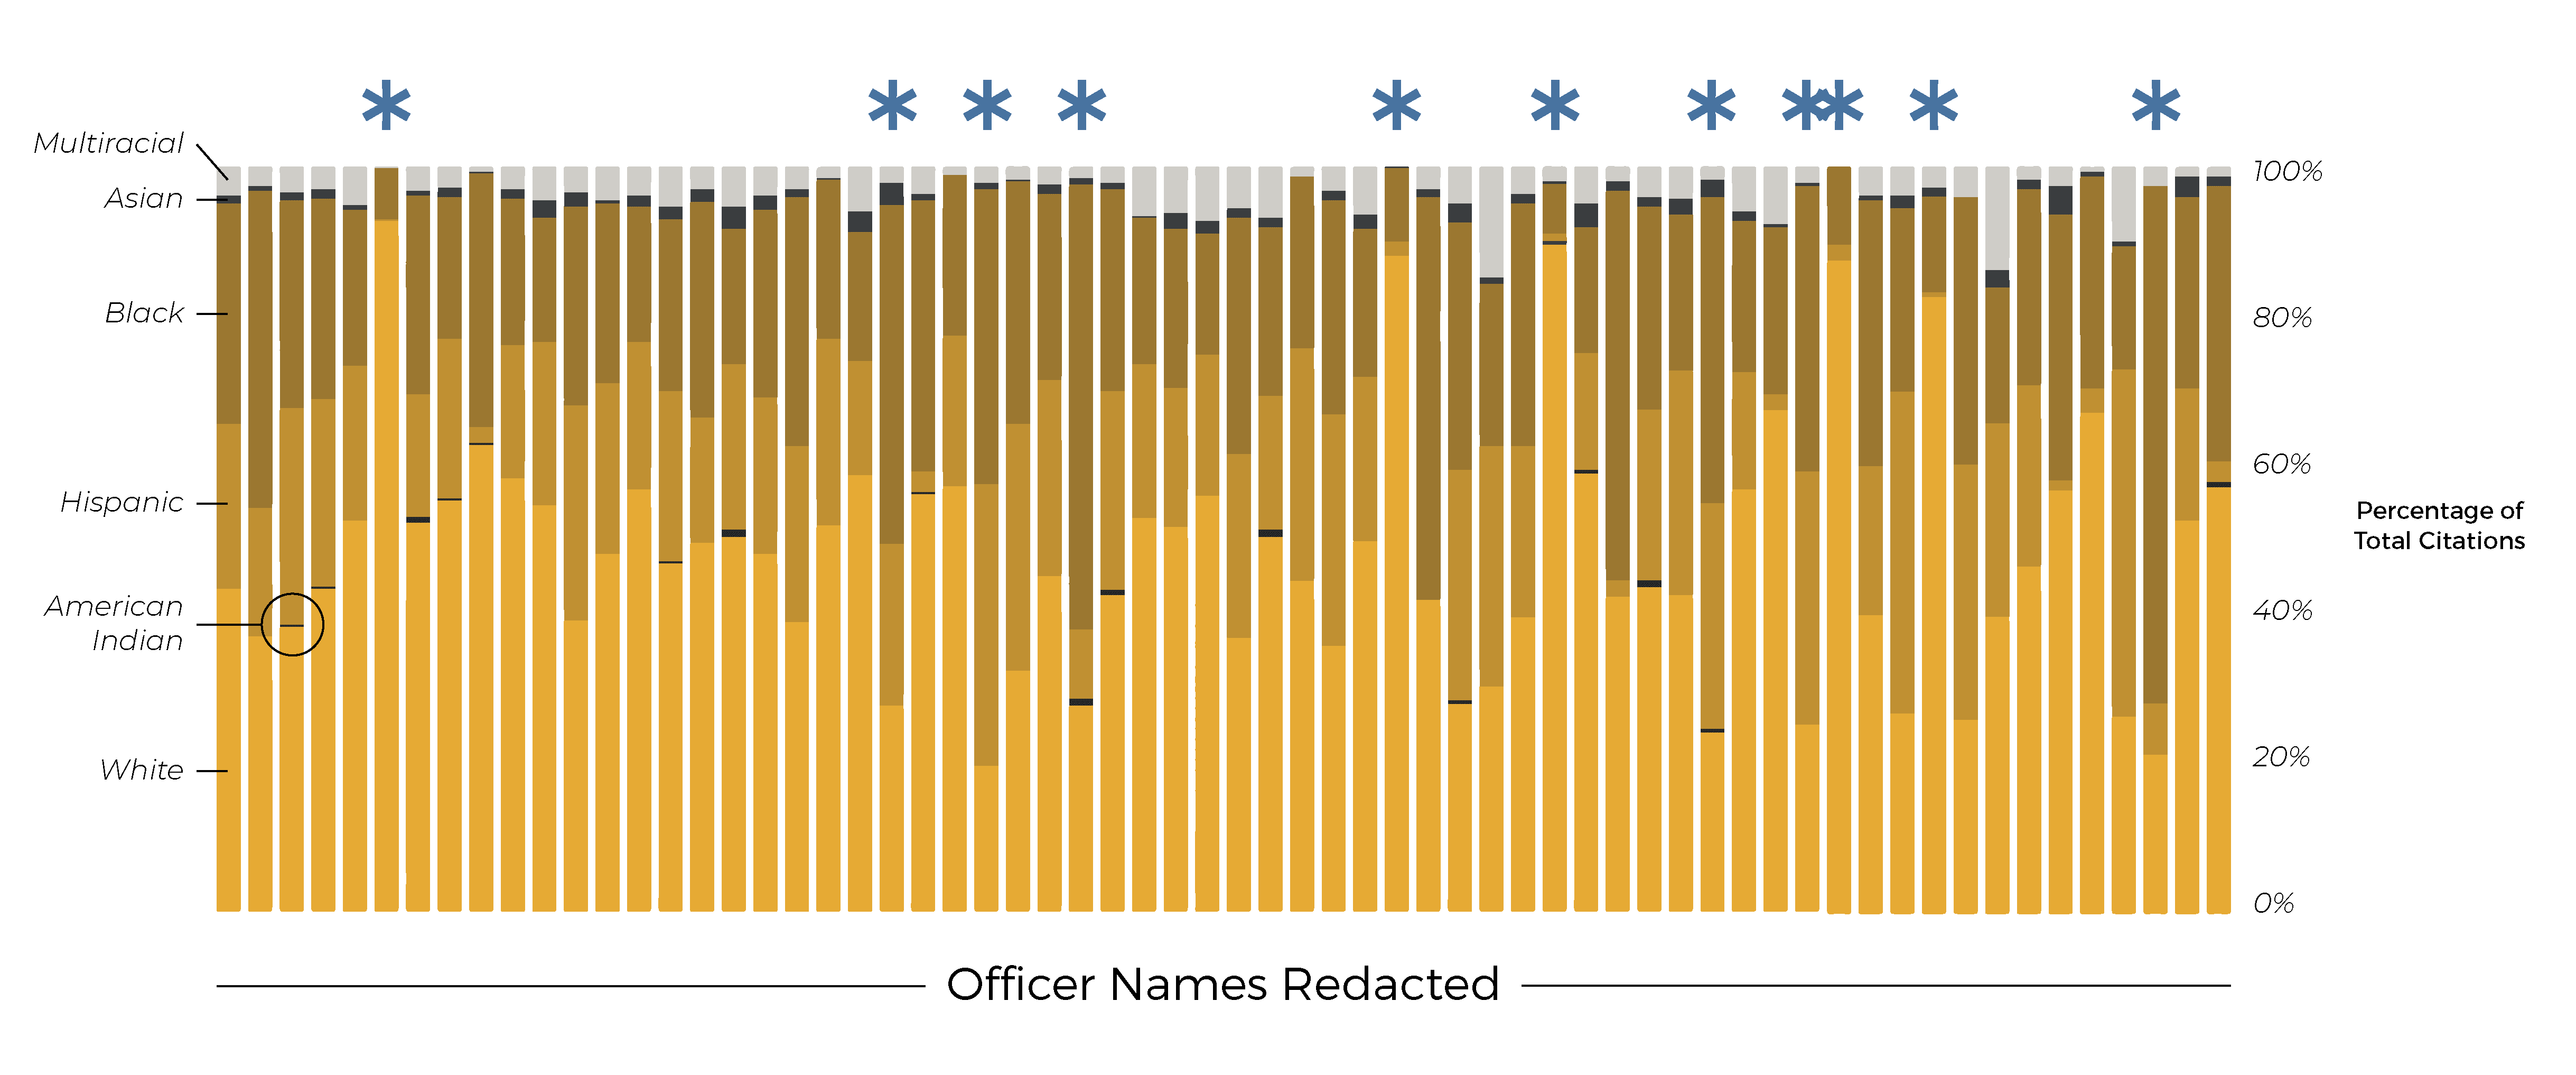
The above view shows the racial/ethnic distribution of traffic citations given by the 75 officers in Palm Beach County with the most tickets given over the last year. The distribution of the race/ethnicity of those given citations is then shown for each officer. The columns with asterisks point to officers who have racial/ethnic distributions that are significantly unbalanced compared to the department as a whole.
While it makes sense that officers who patrol minority neighborhoods would have a higher distribution of one race or another, a few of these examples seem highly unlikely even given that caveat. For instance:
- There are at least three officers who gave 88%+ of their citations to white people.
- There are at least two officers who gave 75%+ of their citations to nonwhite people.
While there may be good explanations for these outliers, identifying them enables us to ask for clarification or further investigation. Cops who cite one race/ethnicity 90% of the time should be made to answer as to what could have resulted in such an uneven distribution.
Racial Inequity in Citation Type
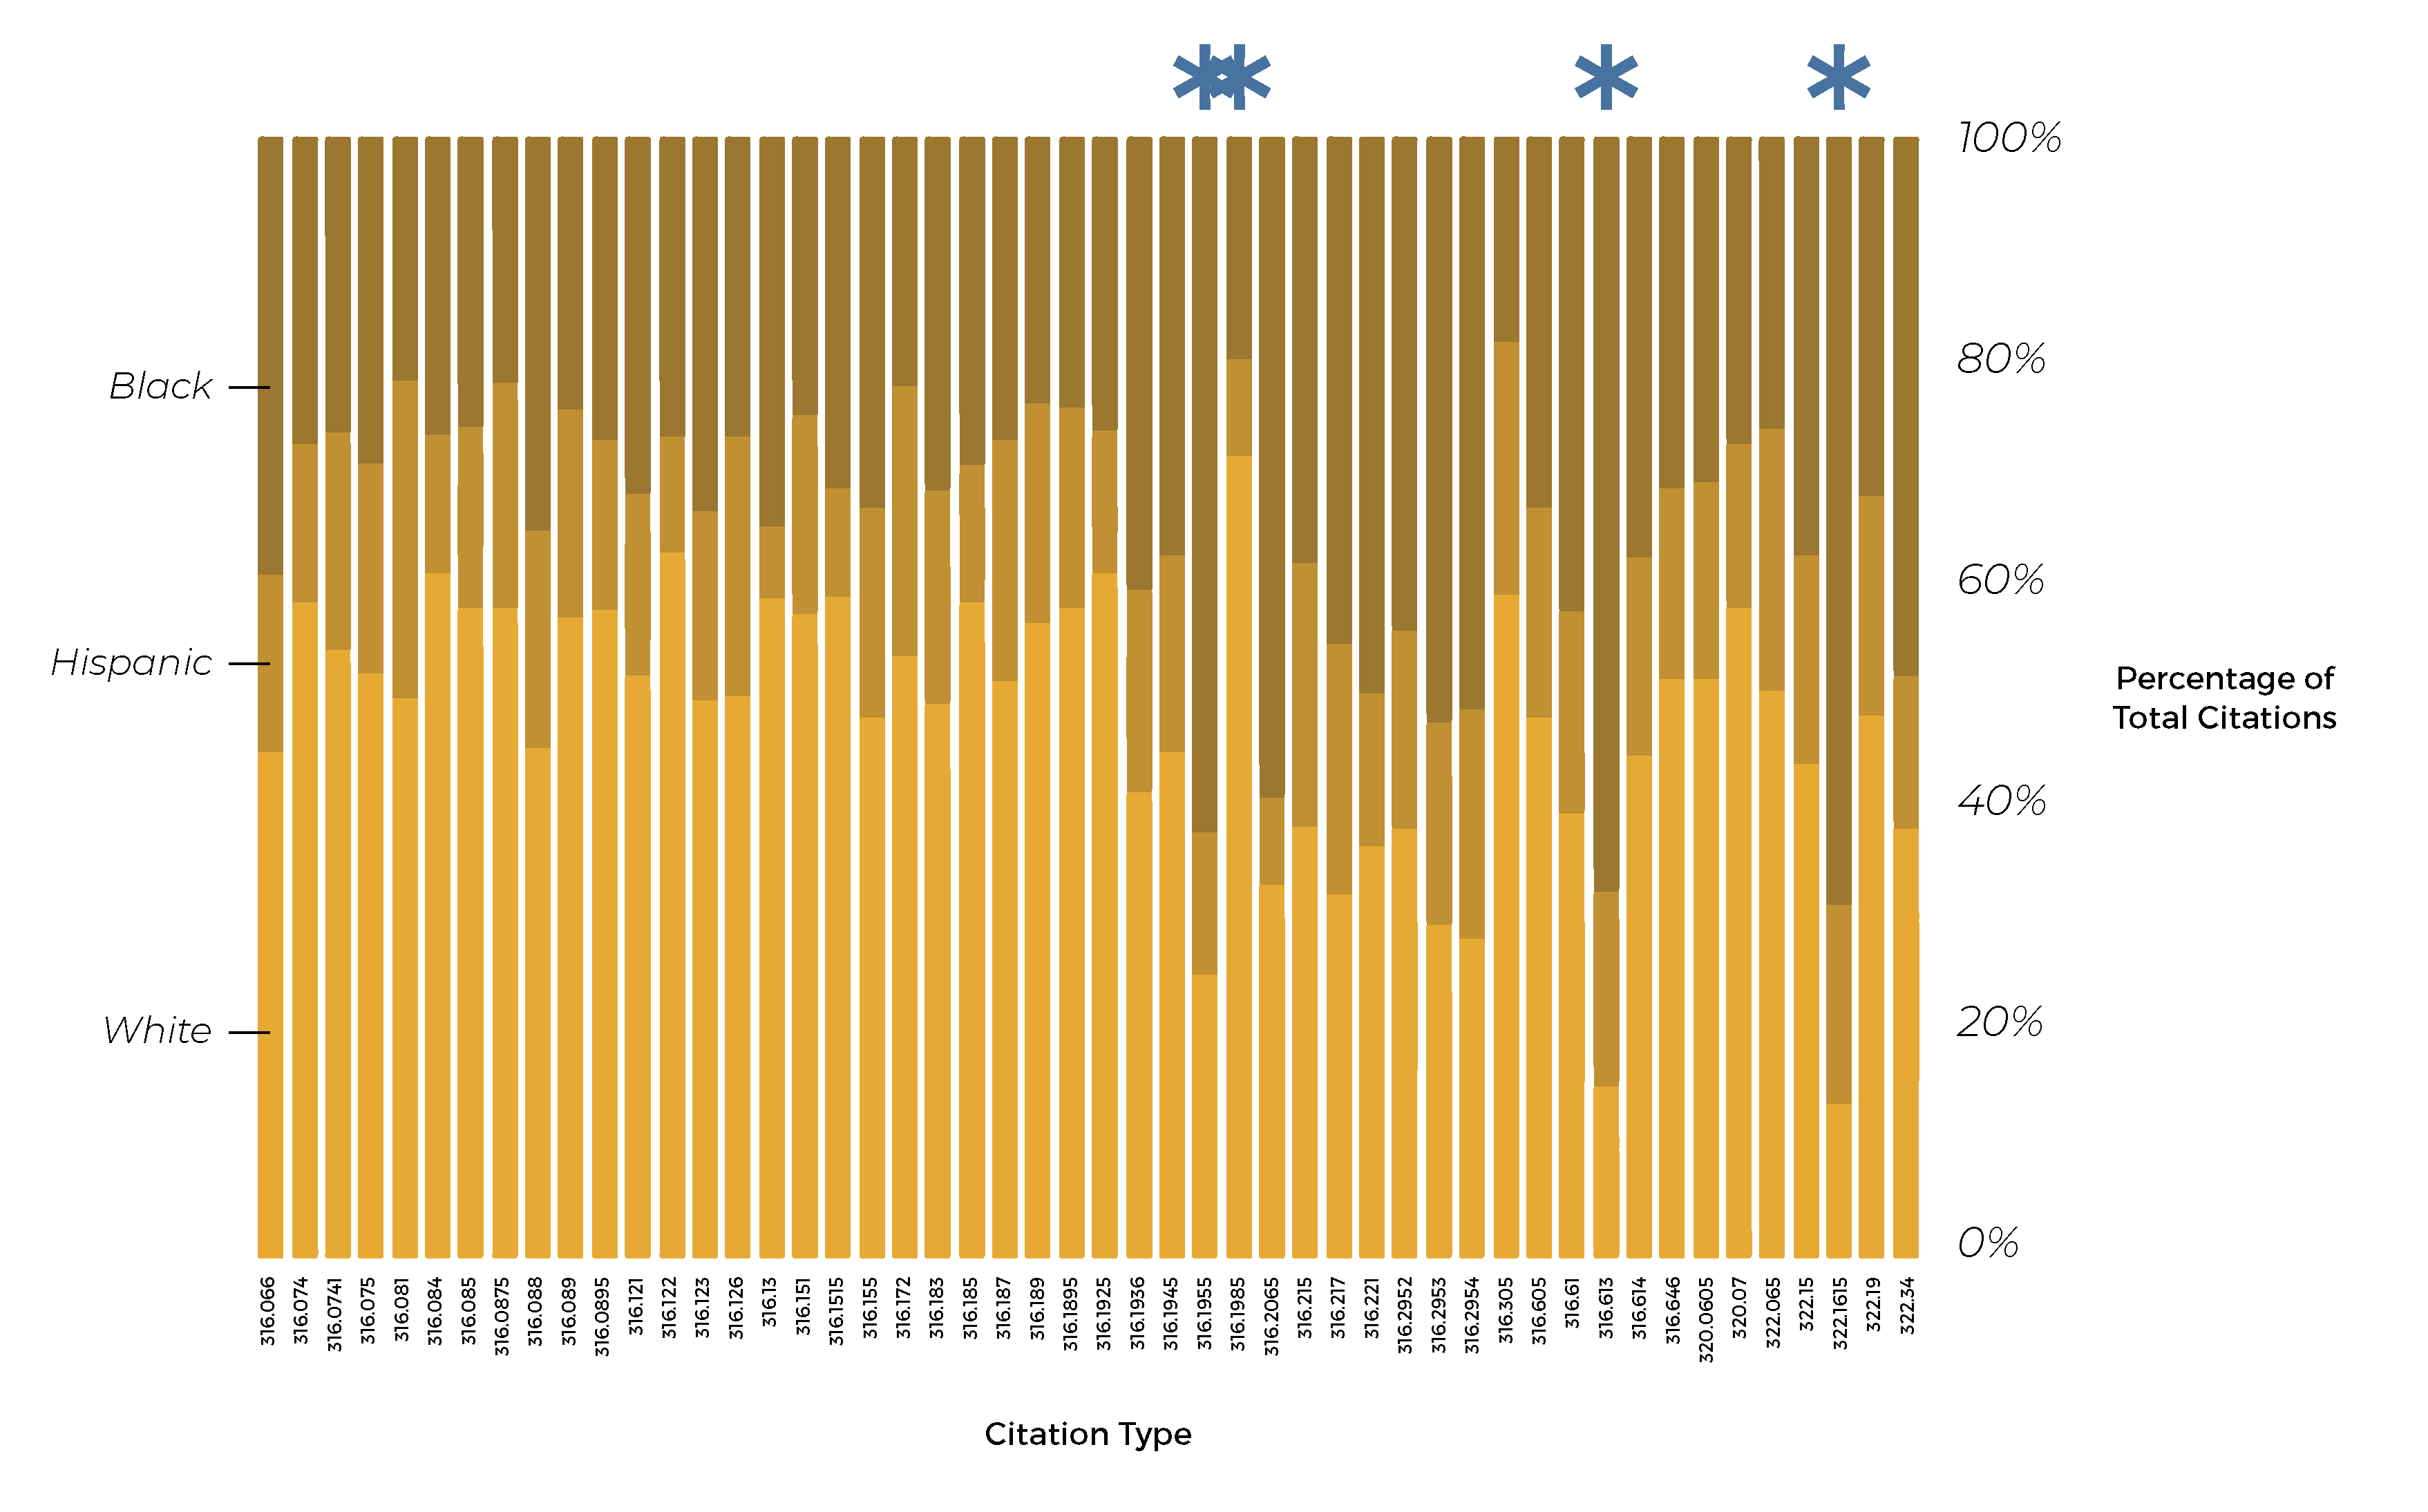
With the full dataset collated, we can also break down traffic citation types by race/ethnicity, allowing us to see if certain types of citations have disproportionate race/ethnicity distributions. In this case, we find several, pointed out with asterisks above. They include:
- Statute 316.1995 – Driving on Sidewalk or Bike Path: ~75% minorities given this citation
- Statute 316.613 – Child Safety Restraints: ~85% minorities given this citation
- Statute 322.615 – Driver’s Permit Violation: ~86% minorities given this citation
- Statute 316.2954 – Window Tint Violation: ~70% minorities given this citation
These percentages seem suspiciously high. The Palm Beach County police force should be held accountable for explaining such inequities. It’s possible that there are good explanations, but these ratios might also represent police profiling or even racism.
With this data, it is even possible to look at the distributions of race/ethnicity by citation for individual police officers, enabling the identification of officers who have overall equitable distributions of race/ethnicity across all traffic citation types but inequitable distributions of some categories of citations.
Palm Beach County Traffic Citations and Gender
Gender bias and sexism in traffic citations can also be looked for when data has been aggregated. Below is a view of the distribution of gender of those given citations for the officers with the most number of citations over the last year.
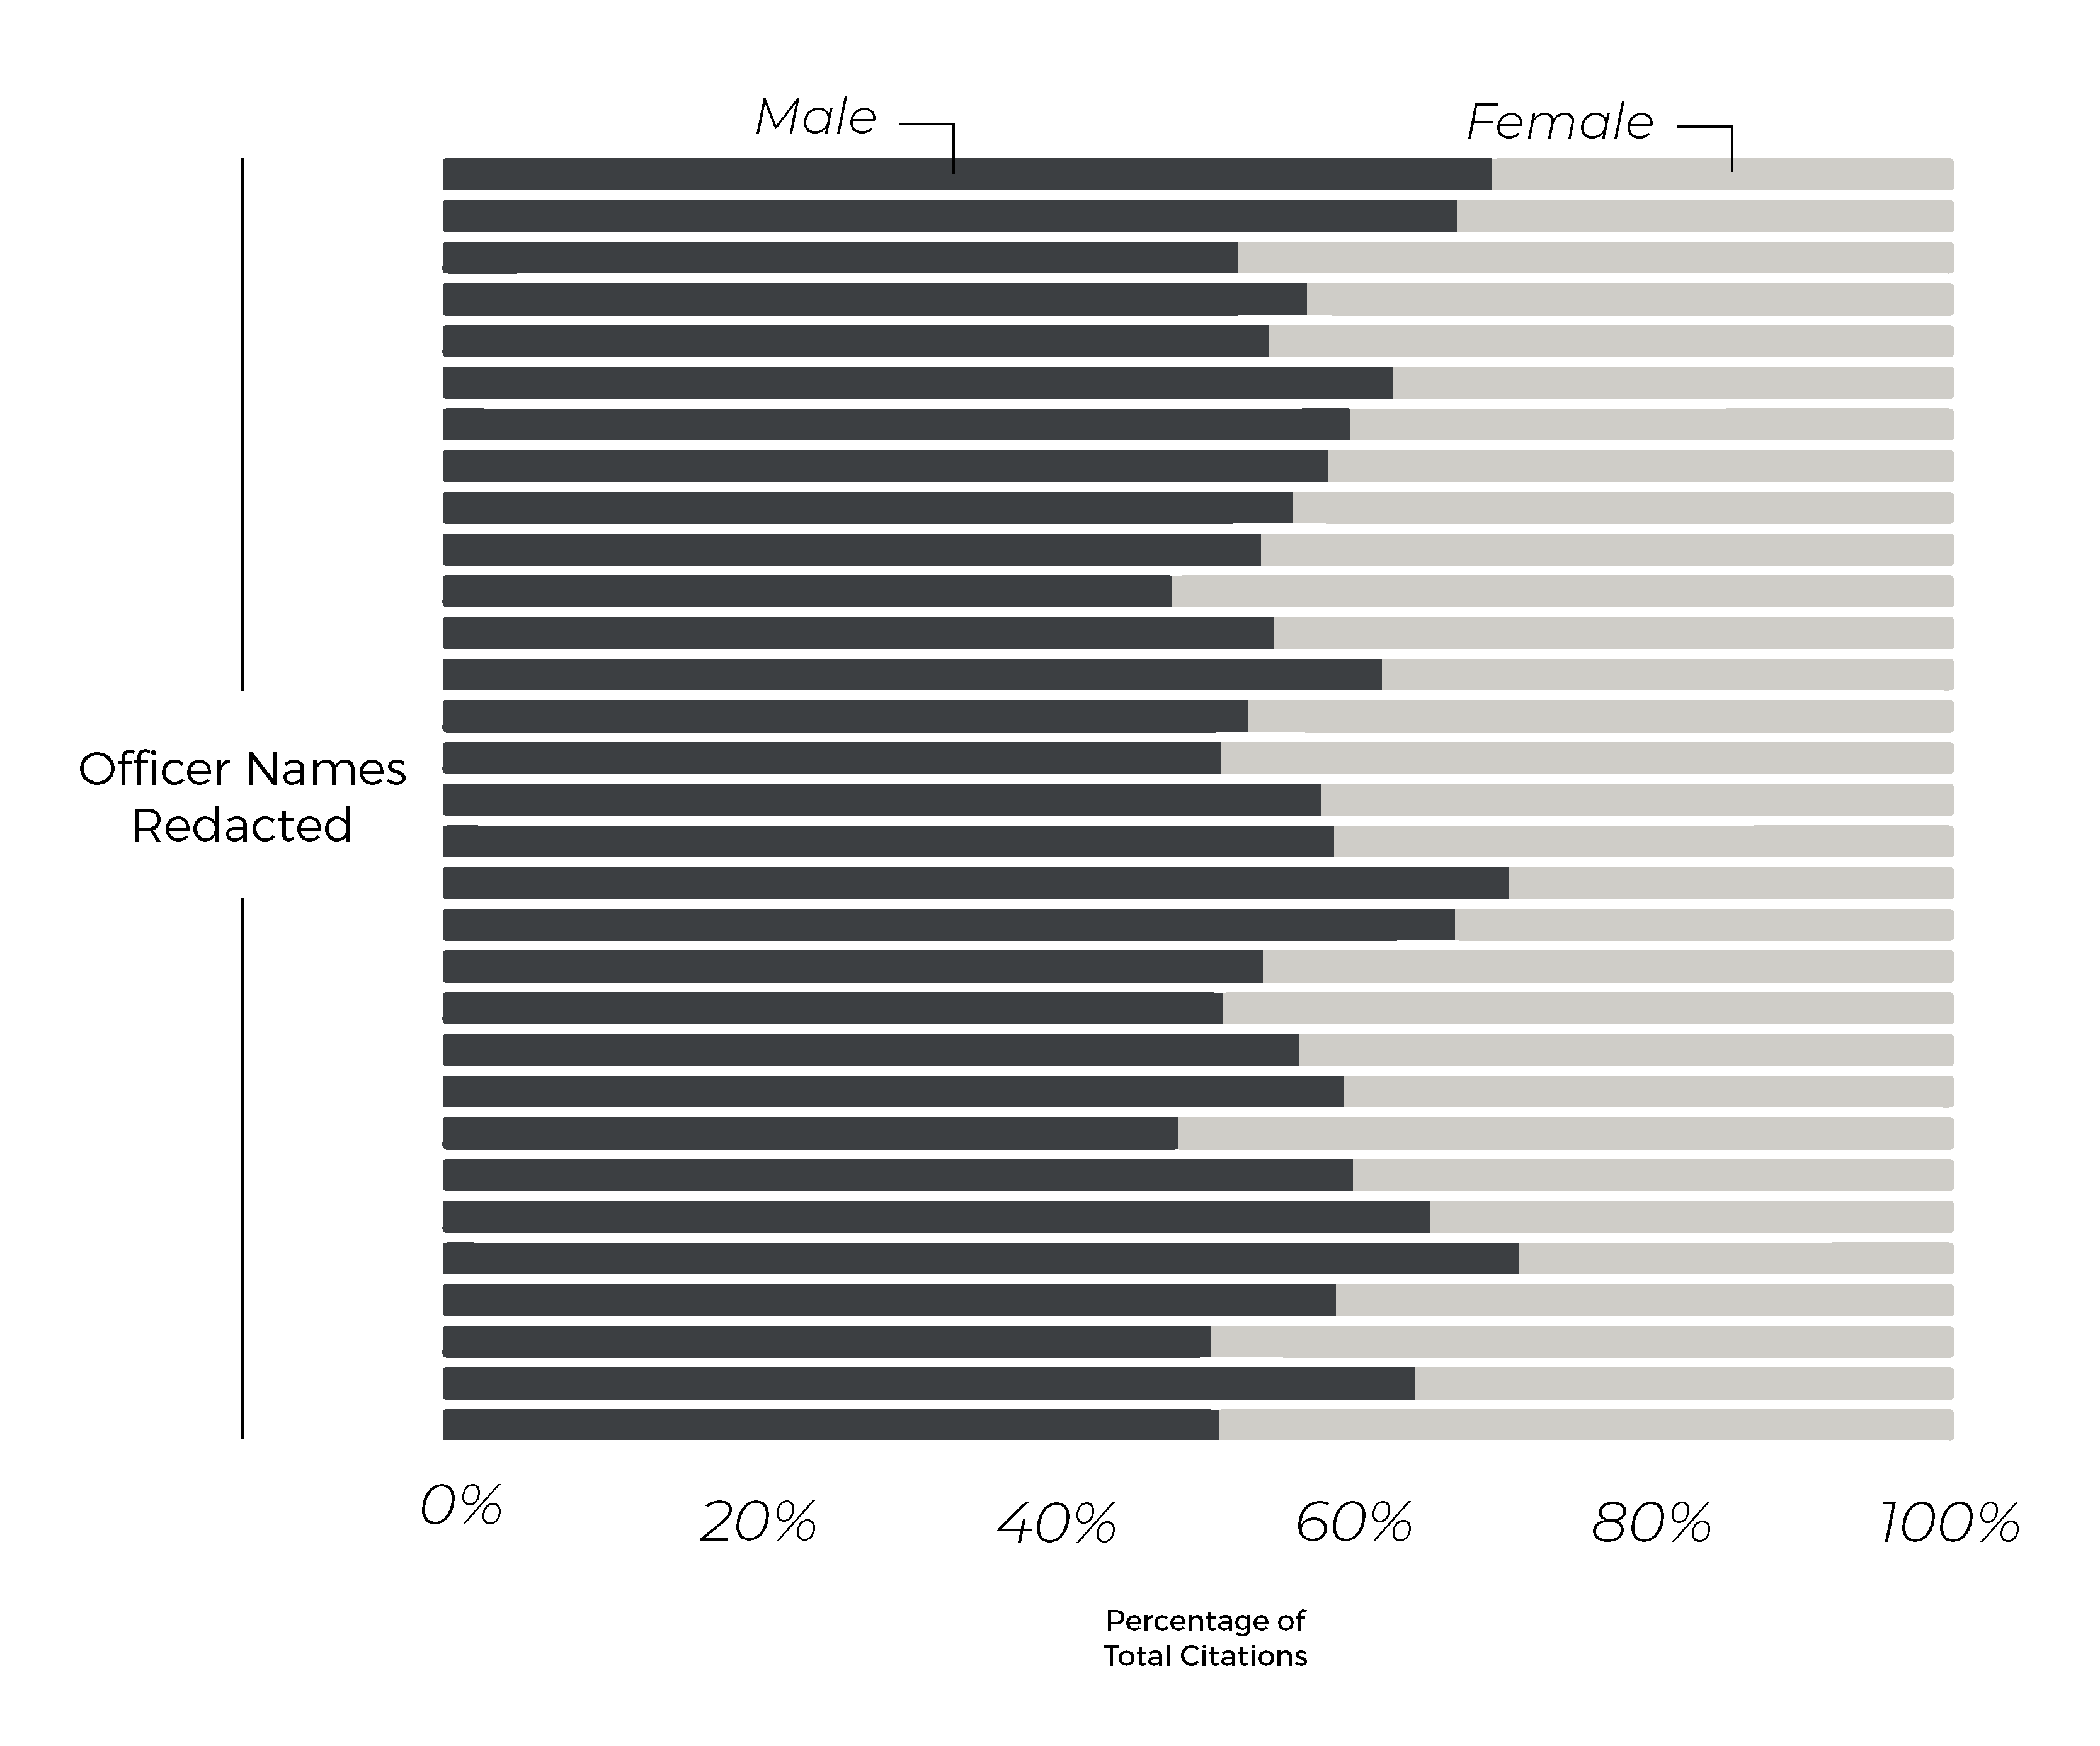
Compared to the distribution of race/ethnicity, we see a much more natural-looking variability, one that can easily be explained away by chance. However, by looking at all officers, some have bizarre distributions of citations by gender, with a handful of officers giving more than 65% of their citations to women, despite men receiving 60% of all citations.
Palm Beach County Traffic Citation Trends and Citation Quotas
While monitoring race/ethnicity and gender bias of individual police officers and departments are most important, additional public data can be analyzed to give citizens the ability to curb other predatory or unfair police practices.
Using this data, it is possible to infer when police departments set internal traffic citation quotas and internal directives that focus on specific traffic statute violations.
Looking cumulatively at all citations given over the last year, we see a clear sway toward certain types of traffic violations.
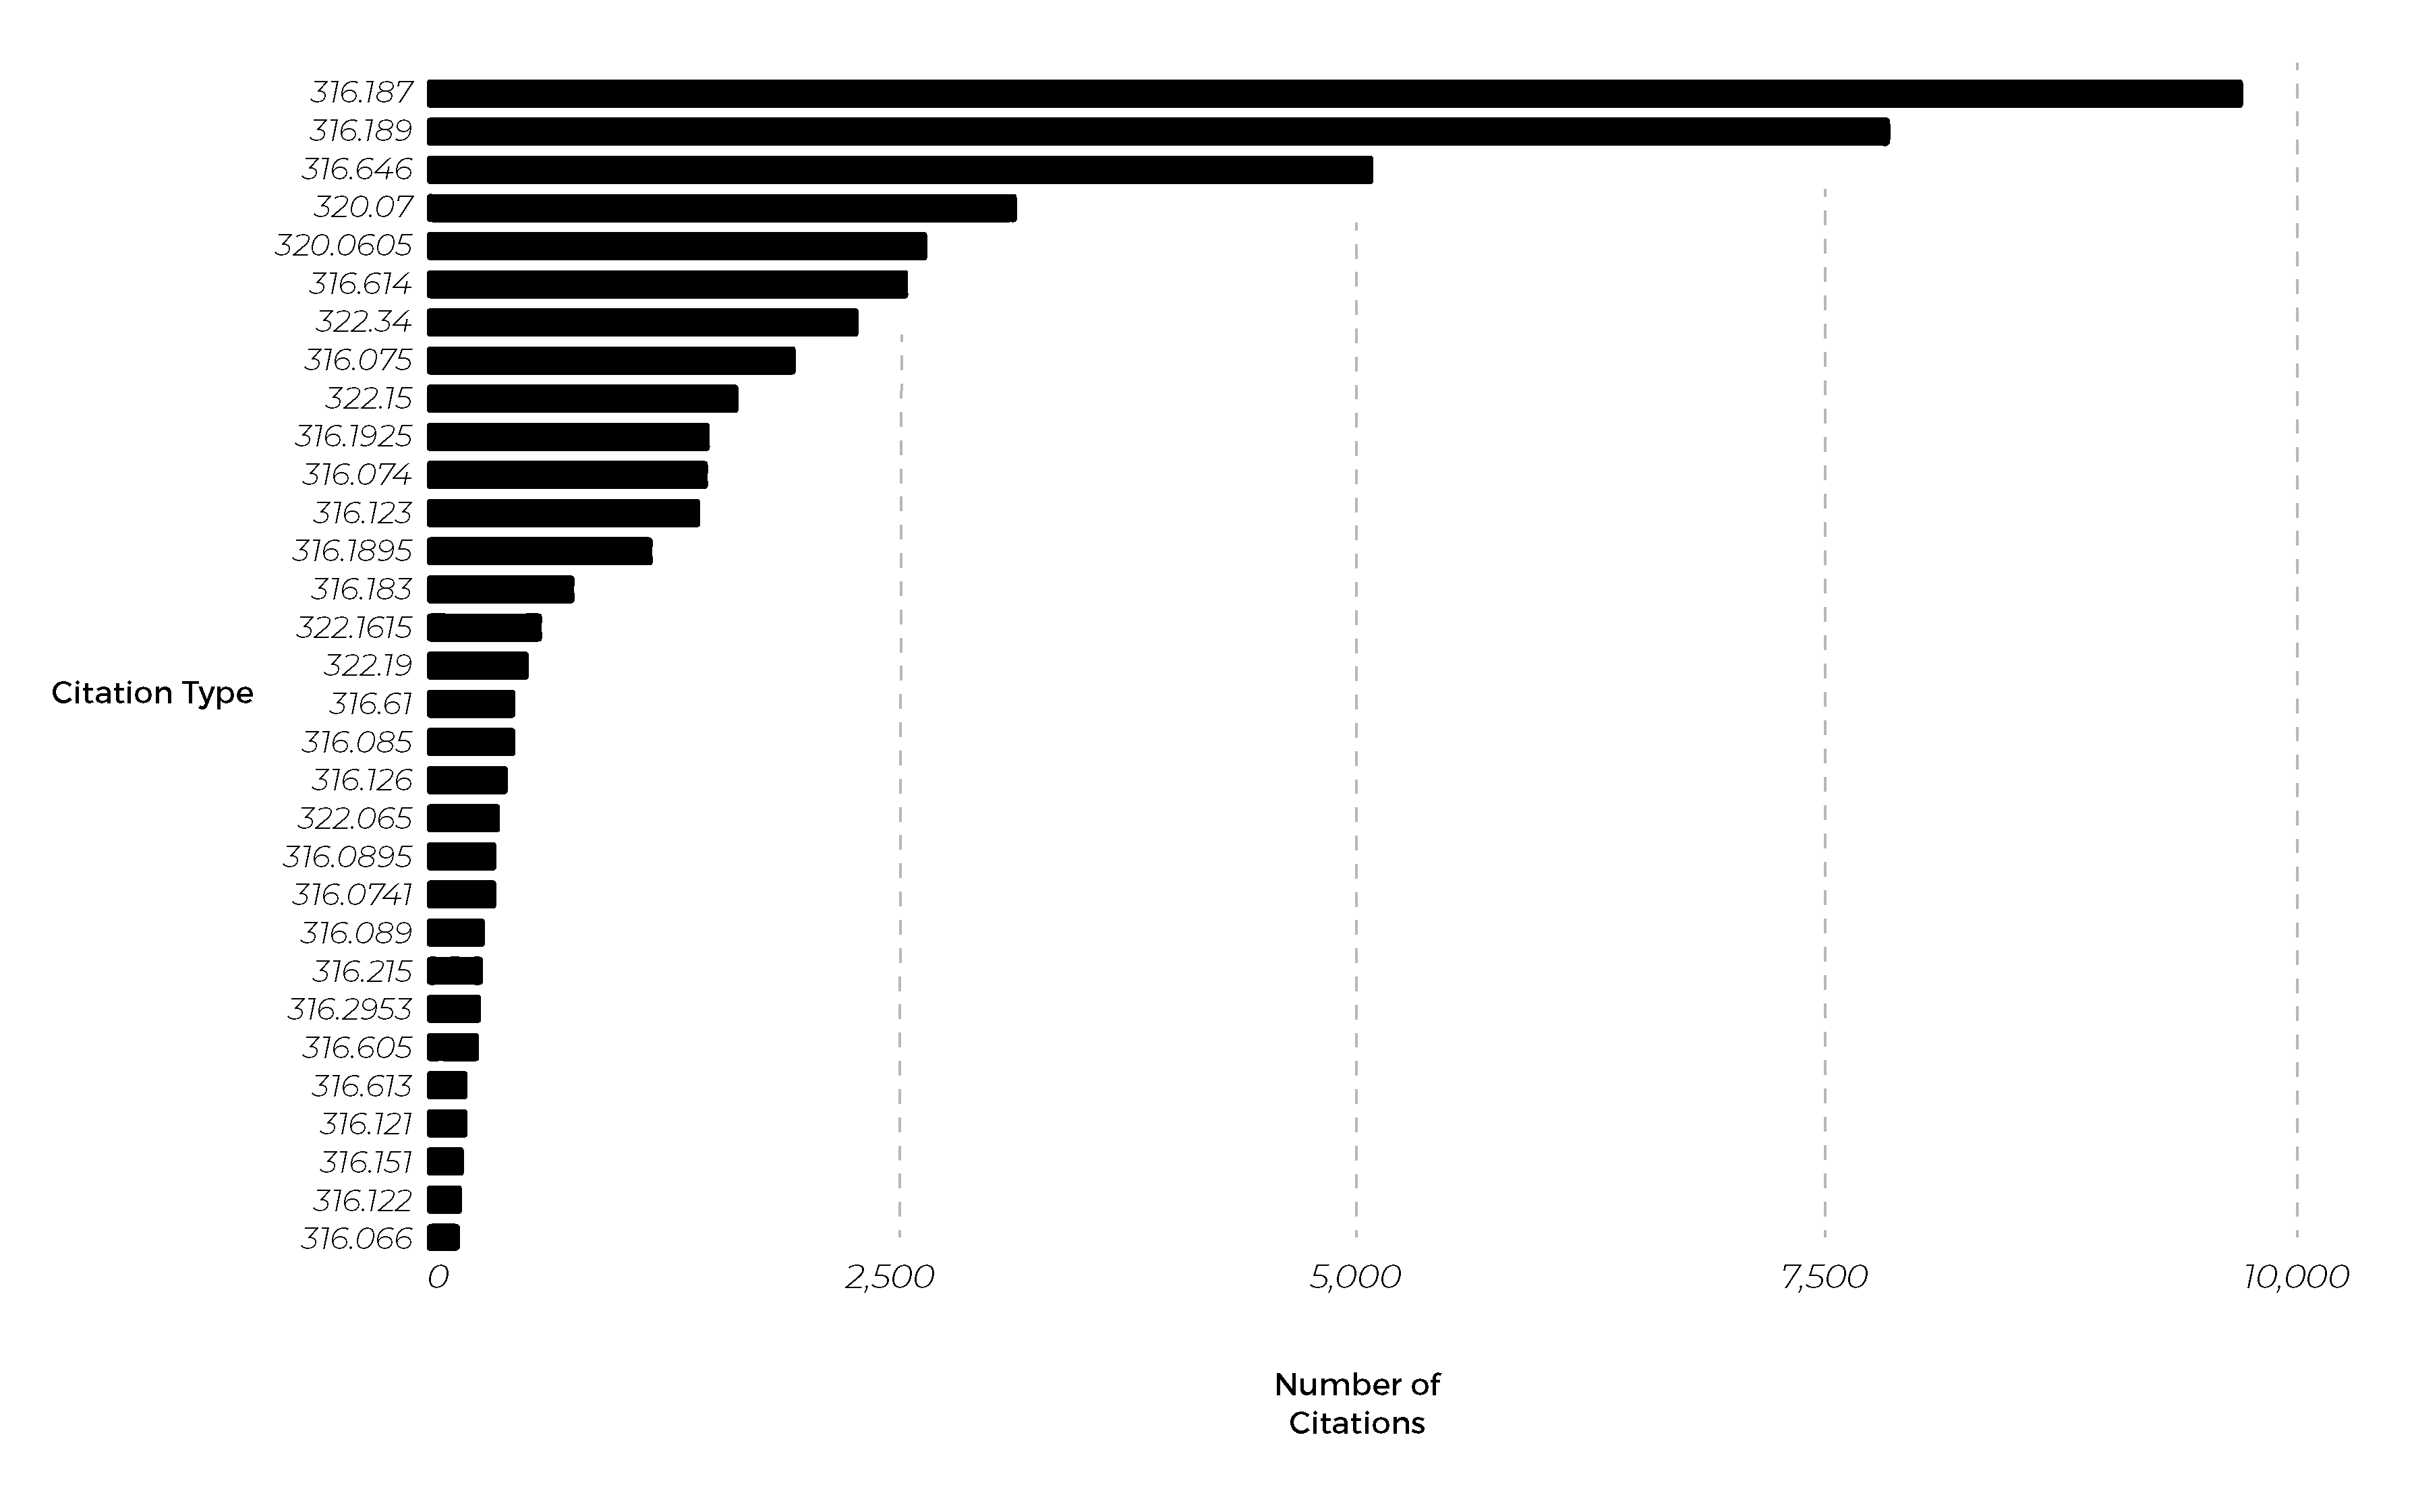
Below are the top 10 statutes that police officers in Palm Beach County most frequently write citations for:
- 316.187 – Speeding on State Roads
- 316.189 –Speeding on City/Municipality Roads
- 316.646 – No Registration or Proof of Insurance
- 320.07 – Expired Registration
- 320.0605 – Secondary Registration Issues
- 316.614 – Safety Belt Violations
- 322.34 – Driving With Suspended/Revoked License
- 316.075 – Traffic Signal Violations
- 322.15 – Driving Without a Driver’s License With Them
- 316.1925 – Careless Driving
This gives us a good sense of the focus of police traffic citations and the most common violation types for the given population. Measuring changes in these numbers over time can give insights into the focus of an entire county, department, or even individual officer.
We can also look at how this department accumulates citations over time.
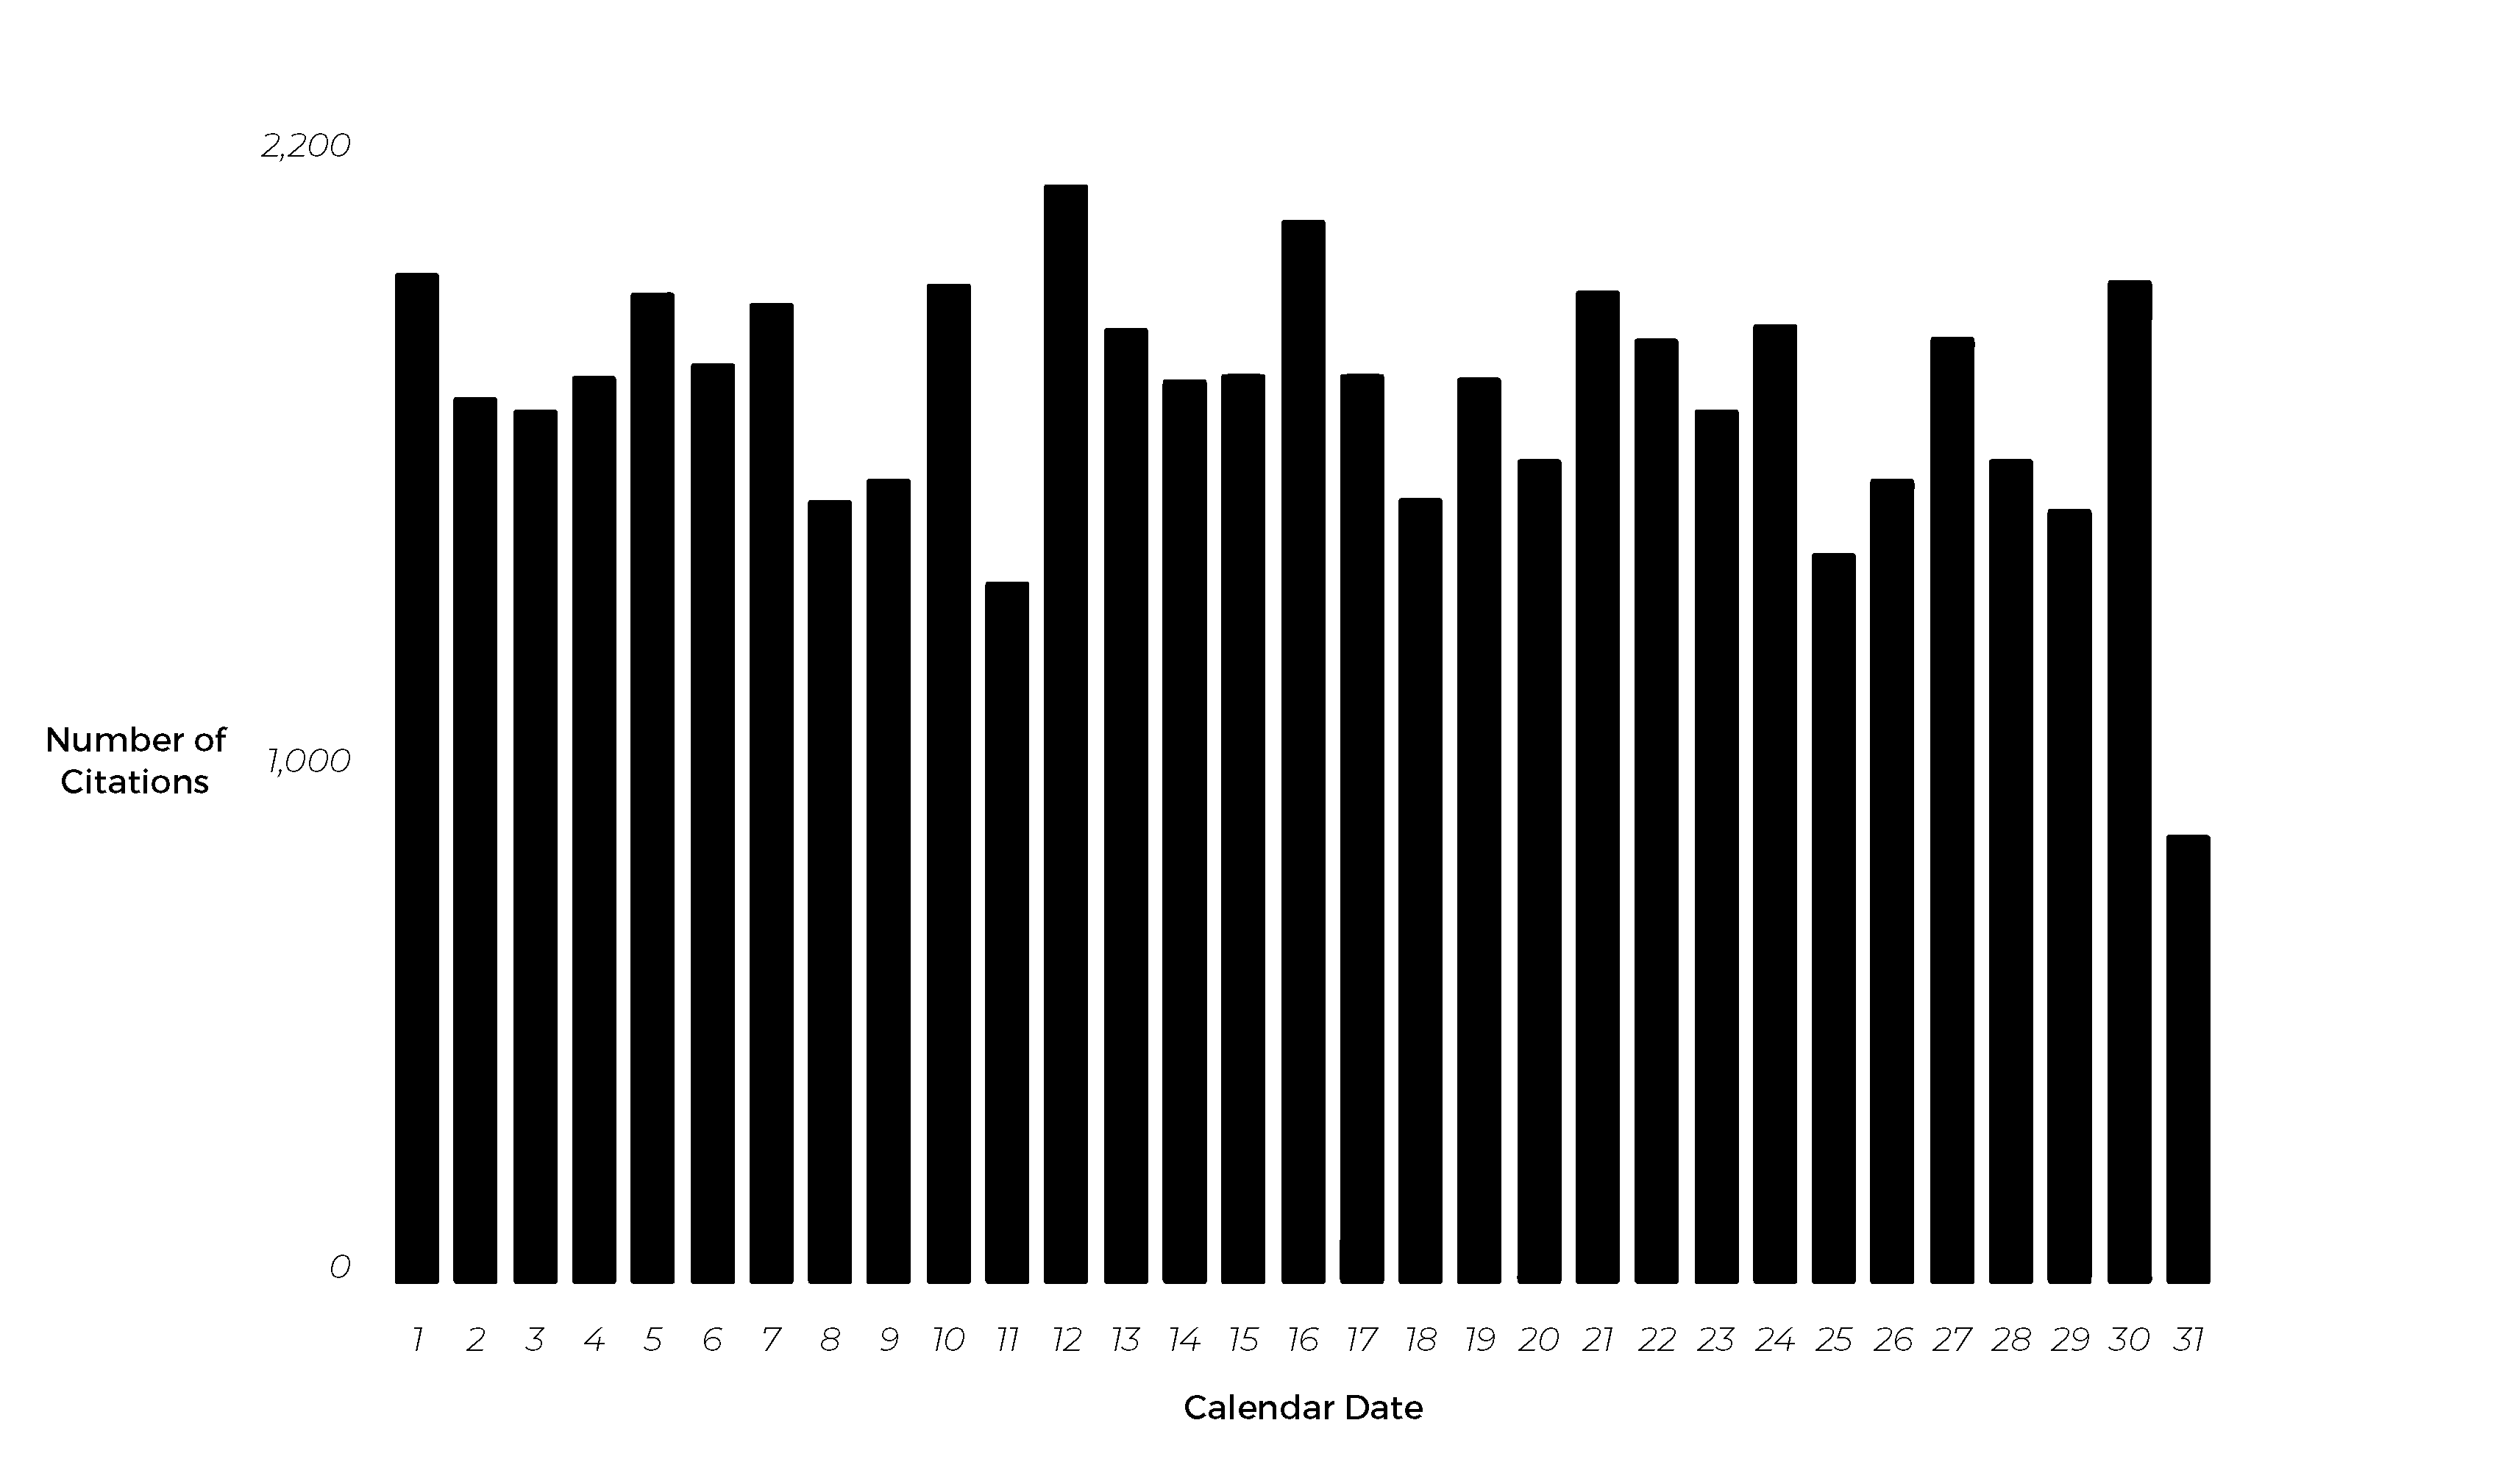
There is a relatively consistent number of citations given over the course of the month, which refutes the common belief that cops pull over more people at the end of the month to hit quotas. While data from other counties may prove to be different, in the case of Palm Beach County data, we don’t really see that.
Furthermore, we can see that there do seem to be at least a few days with significantly larger or smaller numbers of citations given, on average: The 11th and 25th days of the month seem conspicuously light, while the 12th, 16th, and 30th seem conspicuously high in volume.
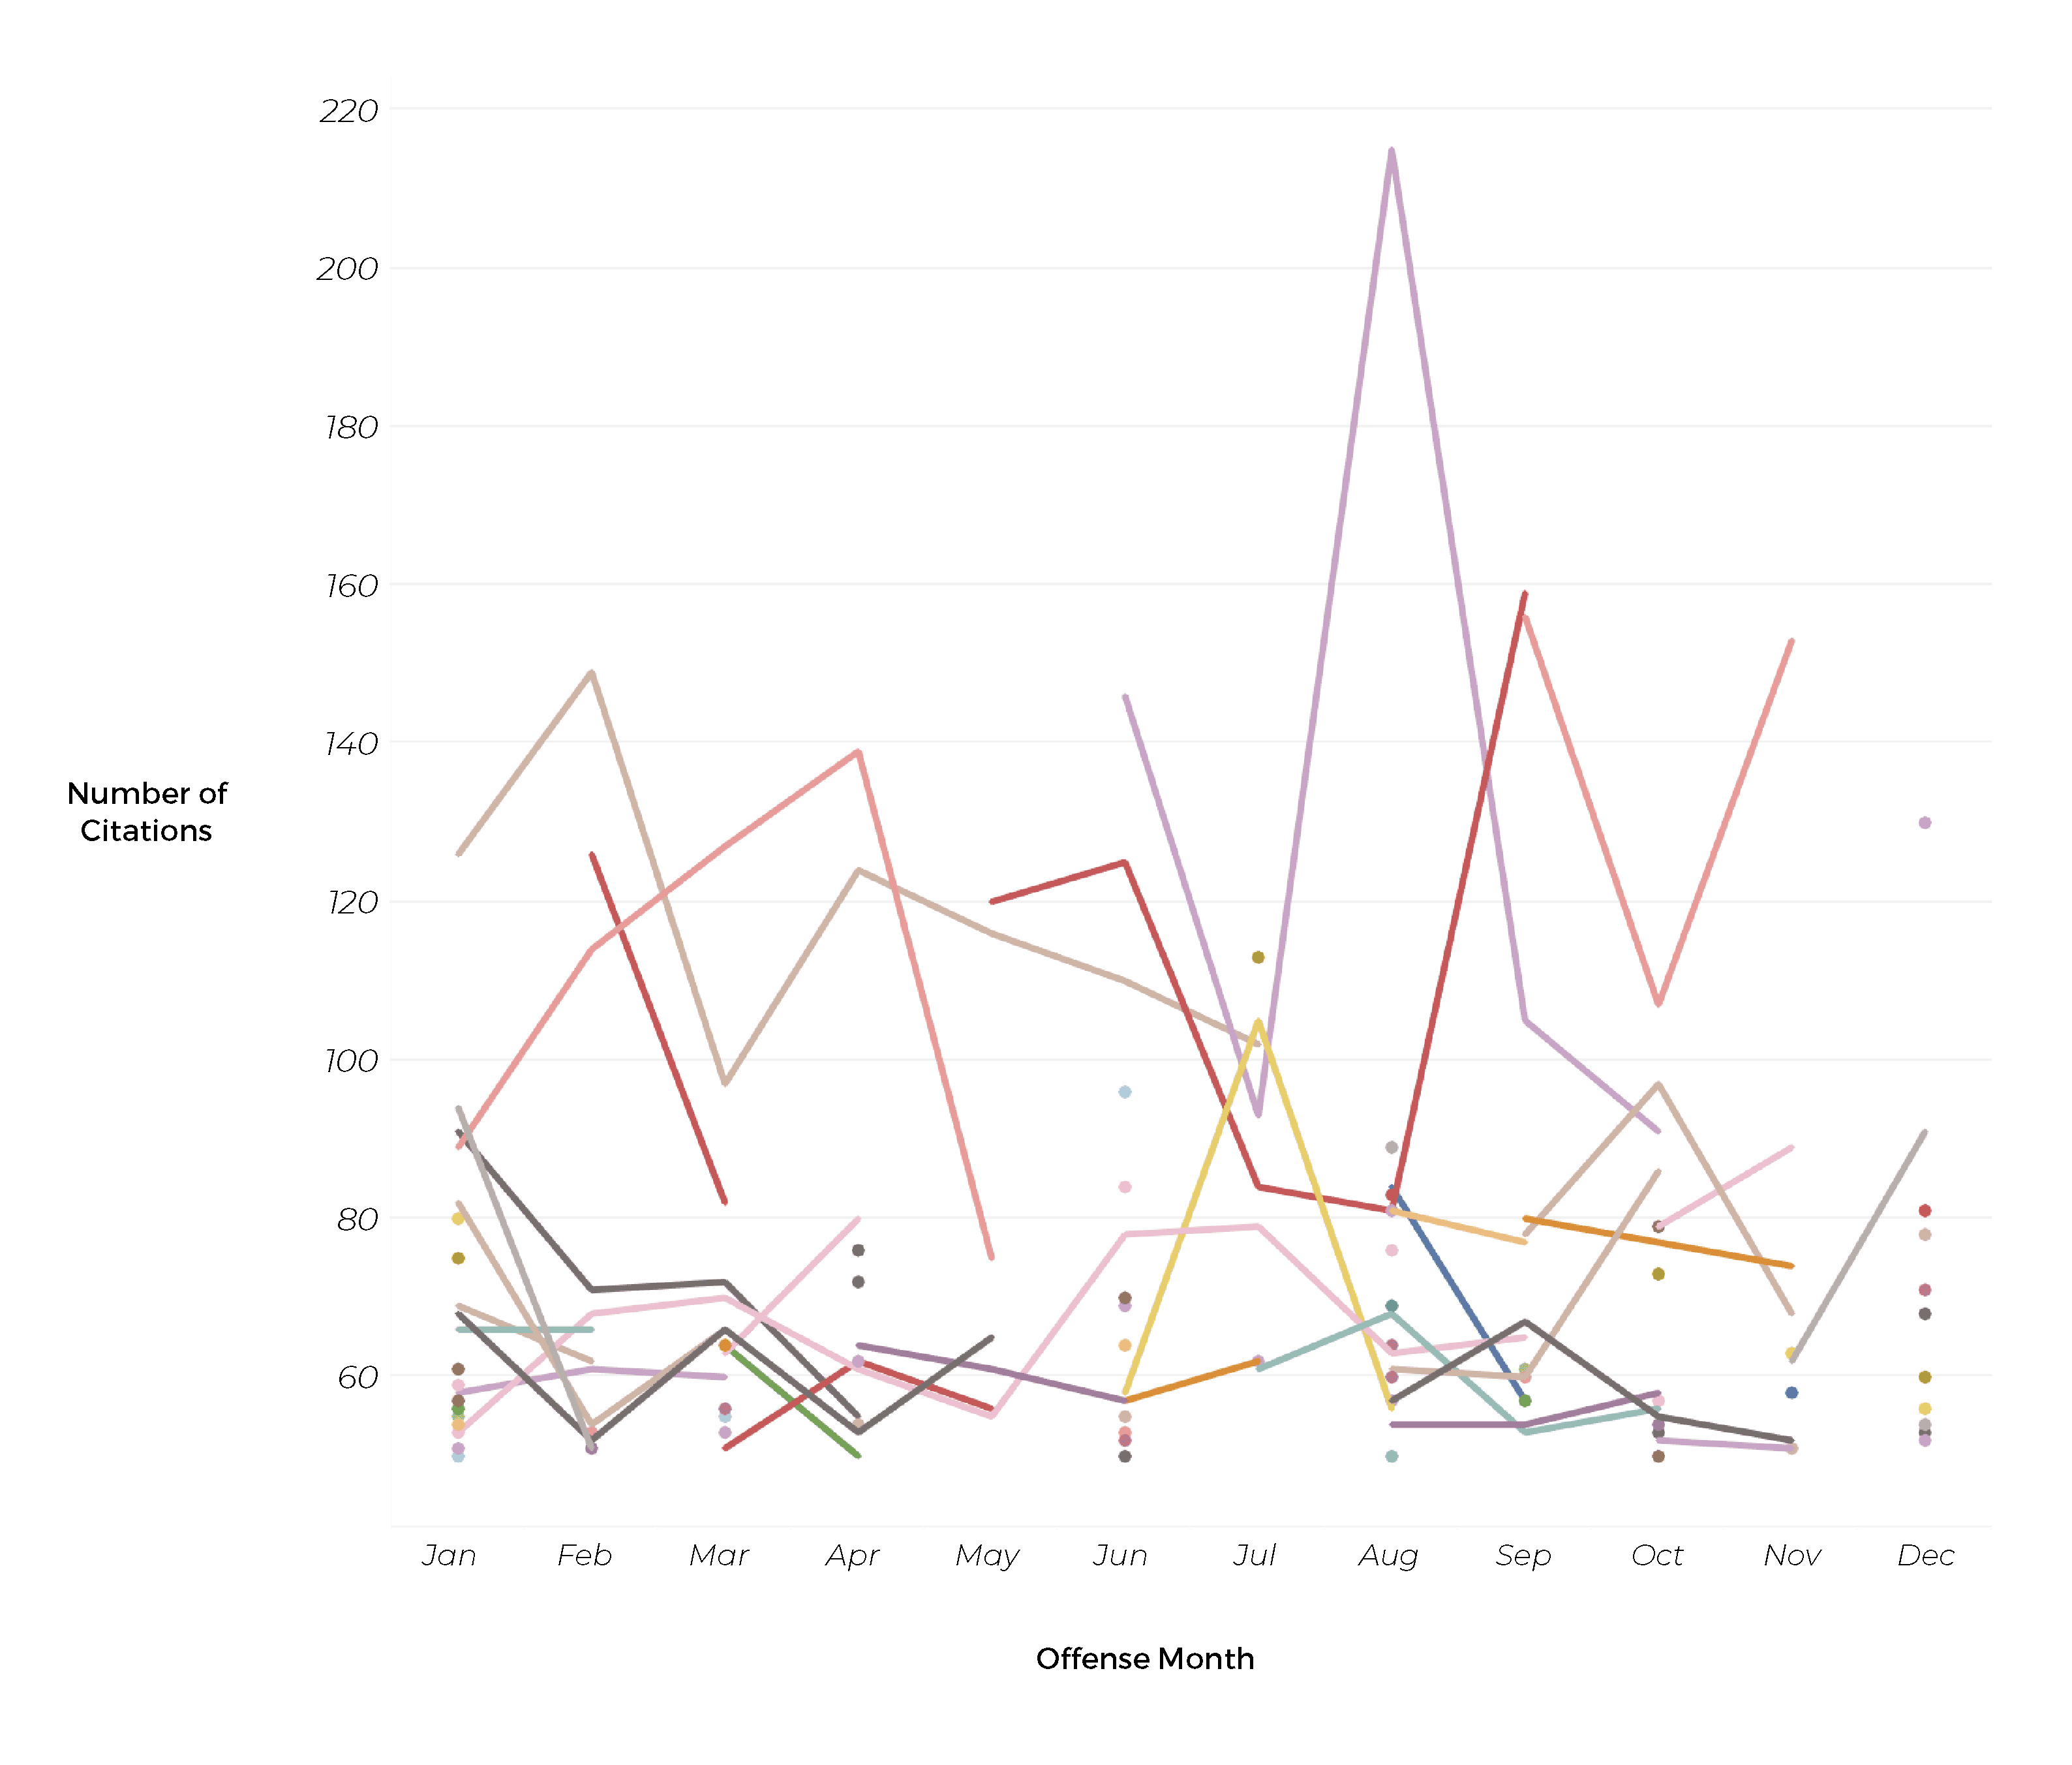
We can also use the data to better understand individual officer citation rates over time. Below is a look at the officers with the highest volume of arrests. It’s interesting to see such wide variability month to month, with some officers even having months-long gaps. Huge gaps or steep decreases would indicate that the officer was tasked with something entirely different during that period, was off duty for some reason, or was otherwise less productive.
The Rabbit Hole Is Very Deep
The data visualizations and explorations above are the tip of the iceberg in terms of what can be done and what can be learned. Police forces around the nation ought to be held accountable for the actions of their departments in their entirety.
It is our firm belief that the integrity of our justice system depends on police and law enforcement bodies being held accountable for their actions. Publicly accessible policing information creates transparency between communities and their specific law enforcement officers, protecting both groups with free access to internal data.
We’ve put together this code to bypass the painstakingly difficult process of individually cataloging each record and to allow the public to explore our findings.
The more inquisitive members of the community we can recruit into regularly examining this level of police data, the better we will be at preemptively identifying troubling overall trends or problems at the individual officer level.
Want to contribute to a larger project to collect this data from many more counties? https://www.reddit.com/r/DataPolice/wiki/how_to_contribute
