Closet Cases – Republicans secretly love what they publicly hate
So far in 2022, more than 300 anti-LGBT bills have been proposed across 36 states – at least one third of which are directed at trans youth. This surge, especially in anti-trans legislation from Republicans, stands in stark contrast to a startling fact.
Republicans love transgender porn, A LOT.
With more than 4.7 Million transgender porn related Google searches each month (per Ahrefs.com), do Republicans represent those searching most? The answer seems to be a clear YES.
In fact, the more Republican they are, the more they seem to like it. (see below)
To understand the Republicans’ love for transgender related porn, we scraped daily Google search trend data from June 1, 2022 to June 19, 2022, segmented by DMA (metro area) and compared search volume to both 2020 election voting trends, and public opinions about LGBT rights.
The data tells a tragic tale of self-loathing closet cases, Republicans who privately get off sexually to trans folks, while publicly trying to remove trans peoples’ rights and stoking hate against them.
Lets get into it...
Who is Most Obsessed With Searching for Trans Porn?
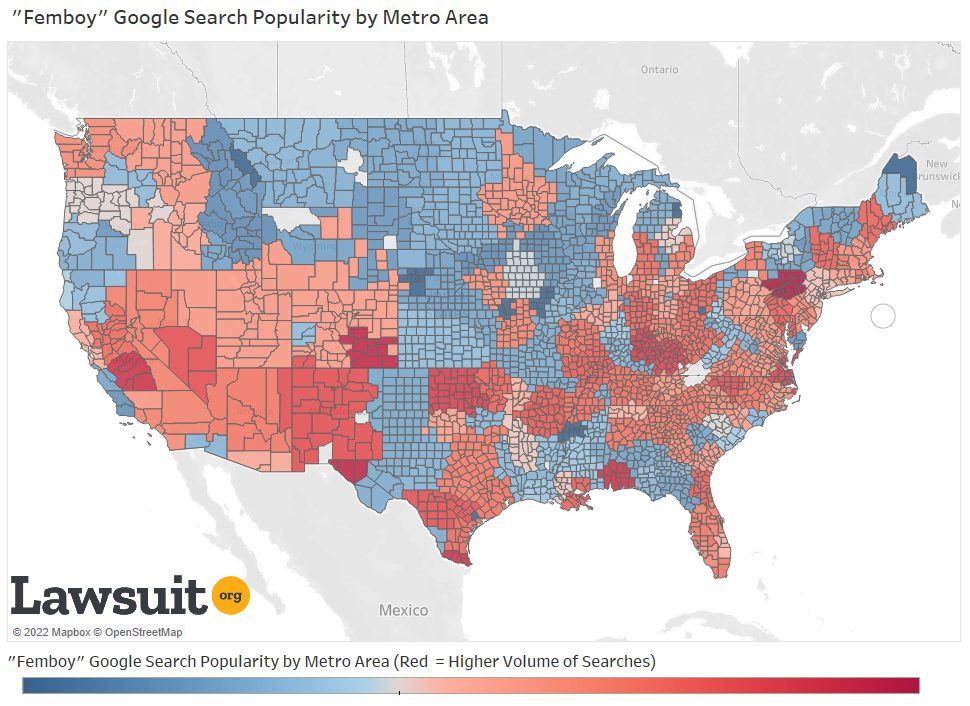
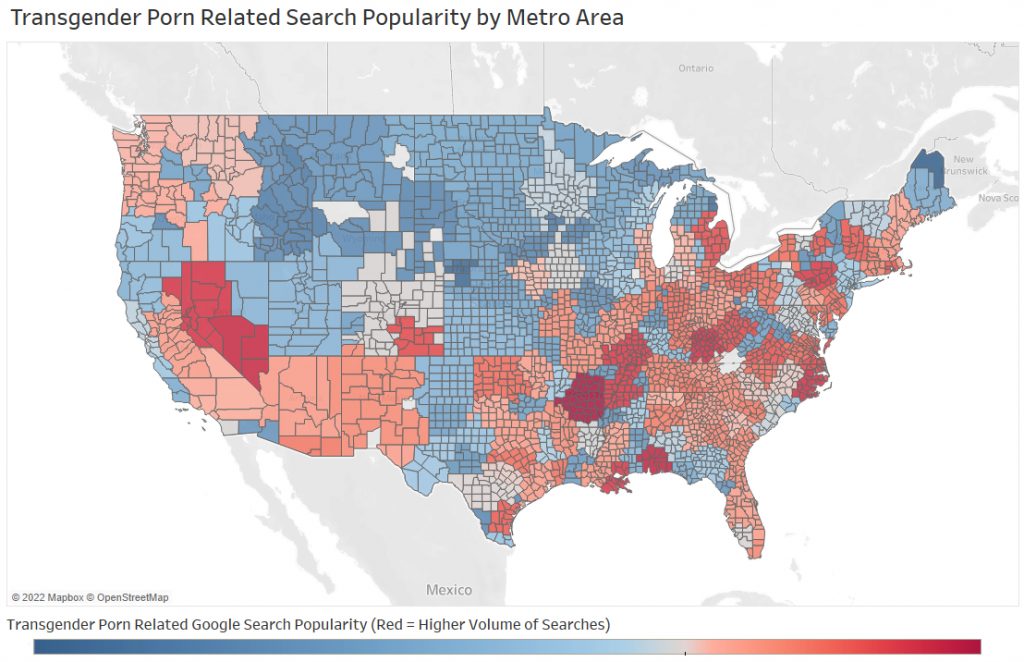
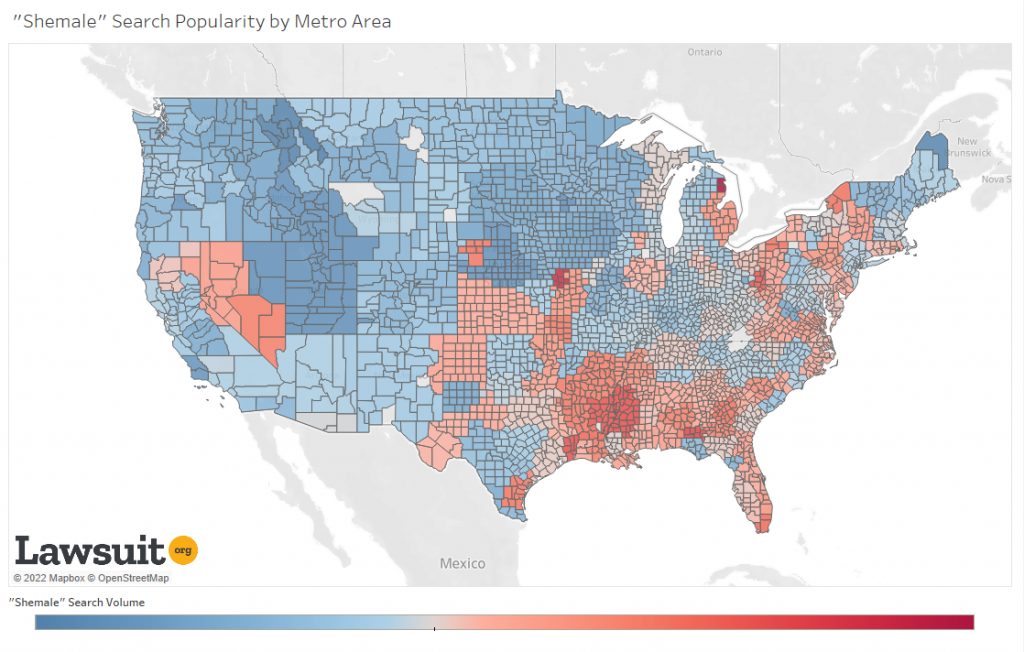
The map visualizations below shows the popularity of the 10 highest volume Transgender Porn related Google Searches, broken down by DMA (Metro Area/County).
**Search terms for the list ranking include only: “shemale”, “tranny”, “femboy”, and “ladyboy”
Top 20 Most Transgender Porn Obsessed States and Metro Areas
- Texas
- Georgia
- Kentucky
- Missouri
- Kansas
- Virginia
- North Carolina
- Illinois
- Mississippi
- Tennessee
- Ohio
- Indiana
- Arkansas
- Iowa
- Louisiana
- Michigan
- Oklahoma
- Alabama
- Florida
- Pennsylvania
- Wichita Falls TX & Lawton, OK
- Atlanta, GA
- Denver, CO
- Nashville, TN
- Sioux Falls, SD
- Paducah, KY
- Minneapolis, MN
- Little Rock, AR
- Lexington, KY
- Bismarck, ND
- Amarillo, TX
- Lincoln, NE
- Oklahoma City, OK
- Charleston, WV
- Indianapolis, IN
- Springfield, MA
- Dallas, TX
- Memphis, TN
- Richmond, VA
- Kansas City, MO
The More Red You Get, The More You Love Trans Porn
While the maps and rankings might make it seem obvious that there’s a correlation between conservatism and searching for transgender porn, but by plotting linear regression trend lines, we can better understand the strength of the correlation. In these views, we look at search volume for three different keyword groups vs metro area political leaning. Each dot represents a metro area. Dots are colored their ratio of Democratic vs. Republican votes in the 2020 presidential election. The higher the value (more red), the higher the percentage of that metro area voted for Donald Trump.
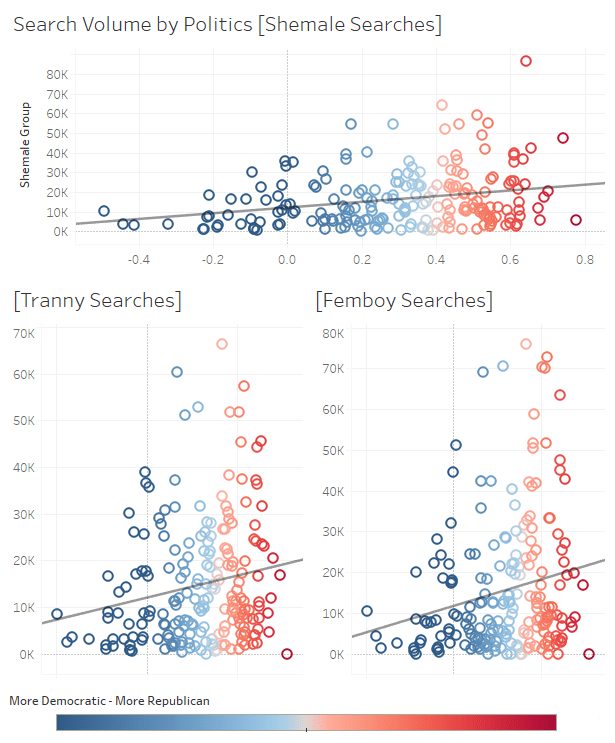
Below you can find the linear regression test values. While this data has low Rsquared values, our P-values show that even this noisy, high-variability data can have a significant trend. The trend indicates that the predictor variable (political leaning) still provides information about the response (transgender search popularity) even though data points fall further from the regression line. For all keywords we investigated, P-values were significant, allowing us to reject the Null Hypothesis. Thus, there is a statistically significant correlation between being more republican, and trans porn search volume, grouped by DMA.
“Shemale” Linear Regression Values
“Tranny” Linear Regression Values
“Femboy” Linear Regression Values
- R-squared: .0669668
- T-Value: 3.81706
- P-Value: .0001793
- R-squared: .0326781
- T-Value: 2.61873
- P-Value: .0094915
- R-squared: .0401511
- T-Value: 2.91404
- P-Value: .003968
The More You Hate Them, The More You Love Them
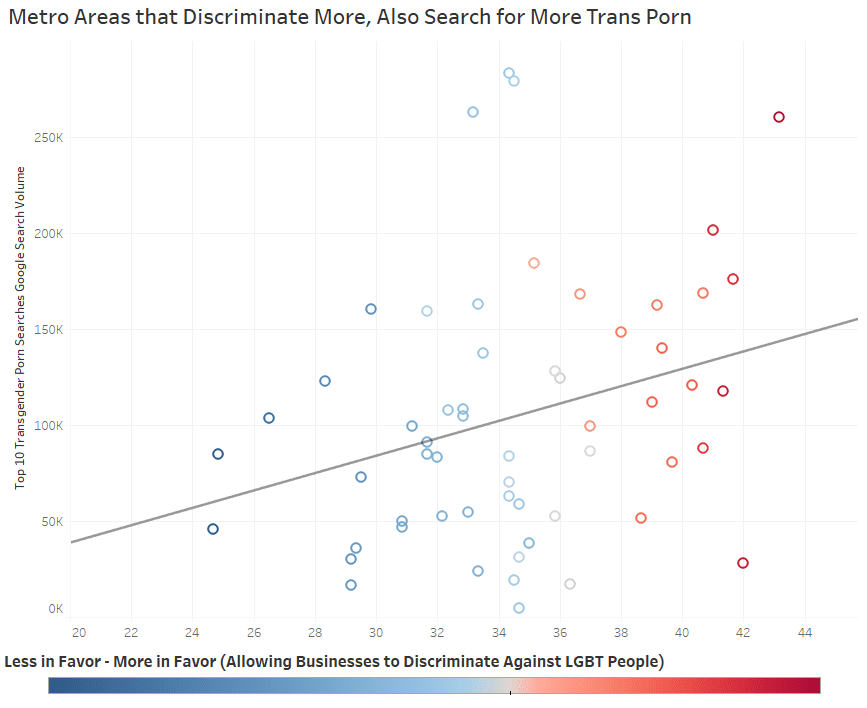
While political leaning is an interesting way to understand the trends in this data, we wanted to better compare search volume data with more direct local estimations of prejudice.
To accomplish this, we looked at data from ava.prri.org, an organization that surveys 50,000 Americans annually across 30 metro areas every year on social and religious opinions. One question they ask is “Do you support religiously based refusals to serve gay and lesbian people?” Respondents could answer “Favor,” “Oppose,” or “Don’t Know/Not Sure.”
We felt this survey question was a decent proxy for baseline LGBT prejudice, though we recognize some may support the question on Libertarian or Personal freedom grounds that do not have to do with the specific demographics of others.
Our statistical trend lines again show a correlation, this time with higher R-squared and P-values than when looking strictly at voting data.
Linear regression values for this view:
- R-squared: .0842313
- T-Value: 2.24918
- P-Value: .028525
Methodology and Limitations
Raw data and data visualizations can be reviewed here.
All search volume data came from Google trends. Daily hourly trends data by DMA (Metro Area) was collected from June 1, 2022 to June 19, 2022. Because the data was pulled by hour, aggregate values will likely not match what you see on trends.google.com because the web interface shows daily (not hourly) totals. Hourly data was acquired programmatically using PyTrends for each day in the range. It should be noted that data from Google Trends is on a 1-100 “popularity score” scale which is a comparative score of all 200+ DMAs for which Google Trends provides data. The values in the dataset reflect aggregations of this popularity score, not raw search counts (which Google does not provide).
The American Values Atlas draws upon 50,000 annual telephone interviews among a random sample of Americans to deliver an unprecedented level of detail about the United States’ cultural and religious landscape. With its large sample size, the AVA provides a rare look at the profiles of smaller religious communities, such as Jews, Muslims, Mormons, Hindus, Buddhists, and others, who are often omitted from depictions of the country’s religious population. The AVA’s scope also allows its users to explore the increasing diversity of specific regions, all 50 states, and 30 major metropolitan areas.

