Google Trends can provide significant insight into the current zeitgeist. By providing hourly search popularity scores at the DMA (metro area) level, Google Trends can give us deeper insight into how ideas and ideologies differ in popularity by geographic location.

The recent rise of white nationalism has justifiably scared many on both the left and the right. Escalating rhetoric from White Nationalist groups has pushed the idea of “Race War” back into the public consciousness, especially amongst WN and WN adjacent communities.
What follows is a look at Google Search Trends around the search phrase “Race War,” with some analysis around how political affiliation correlates with likelihood to use Google this phrase.
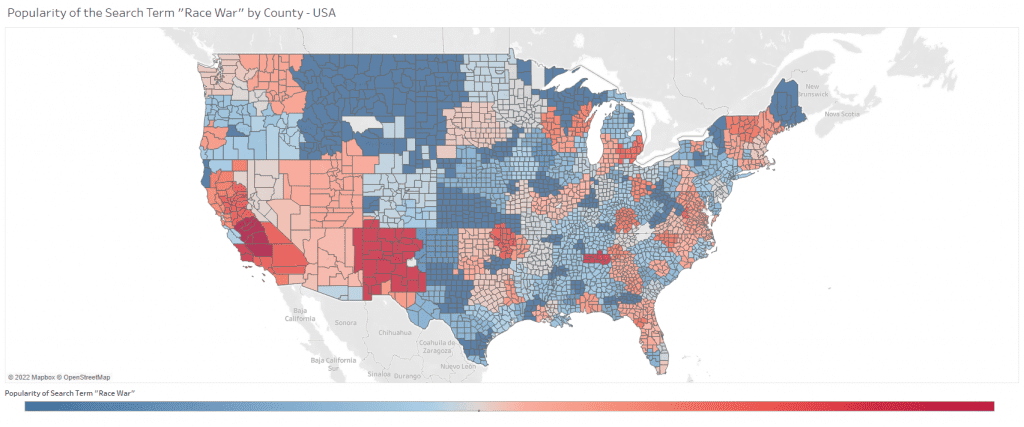
The Counties in the USA Searching for “Race War” Most

Visually, it’s easy to see that “Race War” search popularity shows some intuitive patterns including:
- Proximity to borders
- Conservative Counties
- Rural Counties
Click on the map for an interactive and to see your own county or state’s specific data.
Counties with the Highest Average Search Popularity for “Race War”
- Fresno-Visalia CA 32.702127660
- Bakersfield CA 21.212765957
- Santa Barbara-Santa Maria-San Luis Obispo CA 14.255319149
- Albuquerque-Santa Fe NM 14.127659574
- Huntsville-Decatur (Florence) AL 13.702127660
- Sacramento-Stockton-Modesto CA 12.595744681
- Tulsa OK 12.425531915
- Los Angeles CA 12.340425532
- Lansing MI 12.340425532
- Charlottesville VA 11.978723404
- Detroit MI 11.787234043
- Burlington VT-Plattsburgh NY 11.234042553
- Gainesville FL 11.170212766
- San Diego CA 11.127659574
- Lexington KY 11
- Greensboro-High Point-Winston Salem NC 10.914893617
- Chico-Redding CA 10.914893617
- Green Bay-Appleton WI 10.765957447
- La Crosse-Eau Claire WI 10.361702128
- Chattanooga TN 10.361702128

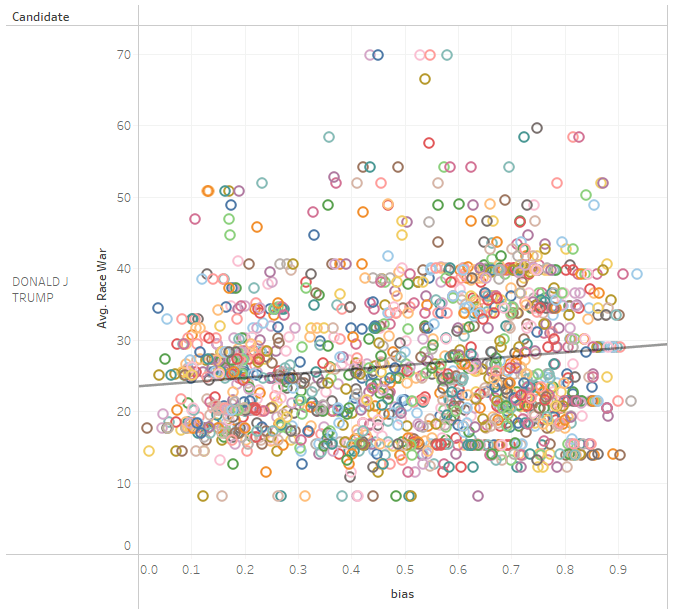
The above chart is a scatterplot showing the relationship between how likely a county was to Vote for Trump (x axis labeled bias indicates percent of all votes that went to Trump for that County, 1 being 100%). Linear regression of this plot gives us a p-value of .001 and an r-value of .020. Interestingly, although we have highly variable data (as shown with the low r-value here), there still seems to be statistical significance and a high enough p-value to reject the null-hypothesis. It seems there is a positive relationship between voting for trump, and being more likely to be searching Google for “Race War.”
Methodology
Raw data and data visualizations can be reviewed here.
All search volume data came from Google trends. Daily hourly trends data by DMA (Metro Area) was collected from June 1, 2022 to July 17, 2022. Because the data was pulled by hour, aggregate values will likely not match what you see on trends.google.com because the web interface shows daily (not hourly) totals. Hourly data was acquired programmatically using PyTrends for each day in the range. It should be noted that data from Google Trends is on a 1-100 “popularity score” scale which is a comparative score of all 200+ DMAs for which Google Trends provides data. The values in the dataset reflect aggregations of this popularity score, not raw search counts (which Google does not provide).
