In the tragic wake of the shooting that took the lives of 22 people, and injured 18 more, gun laws are again a major topic of political debate. Predictably, public tragedies spark fear of new or better enforced gun laws, which then impacts demand for guns.
To better understand the impact of this most recent tragedy on the publics’ desire for purchasing guns, we looked at Google Trends search volume (a 1-100 measure of popularity of a term) for three “high-intent to purchase” search phrases. We looked at daily aggregations of hourly search data, segmented by DMA location for the map visualizations. The data was pulled from May 1, 2022 to June 14, 2022.
Daily Search Volume for “AR-15”
AR-15 searches before the shooting hovered at about 8,000 weekly searches. Immediately after the shooting, that figure spiked to 43,000 searches per week, maintaining volumes in the 30k-50k per week range since.

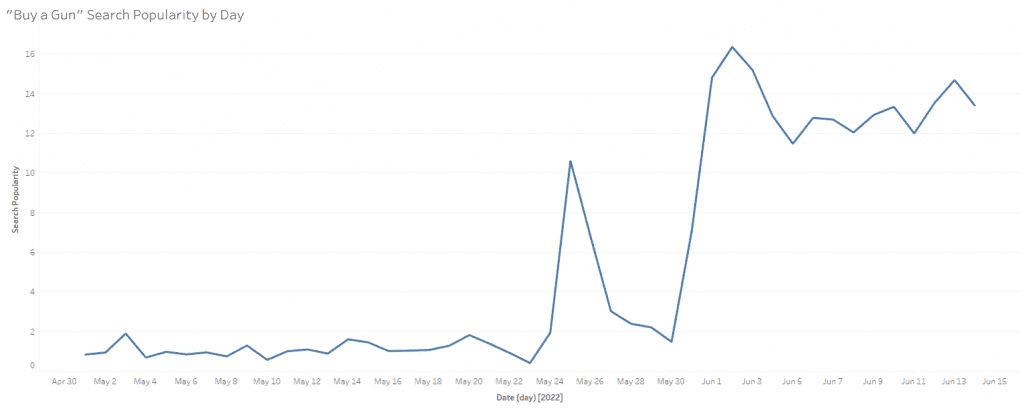
Daily Search Volume for “Buy a Gun”
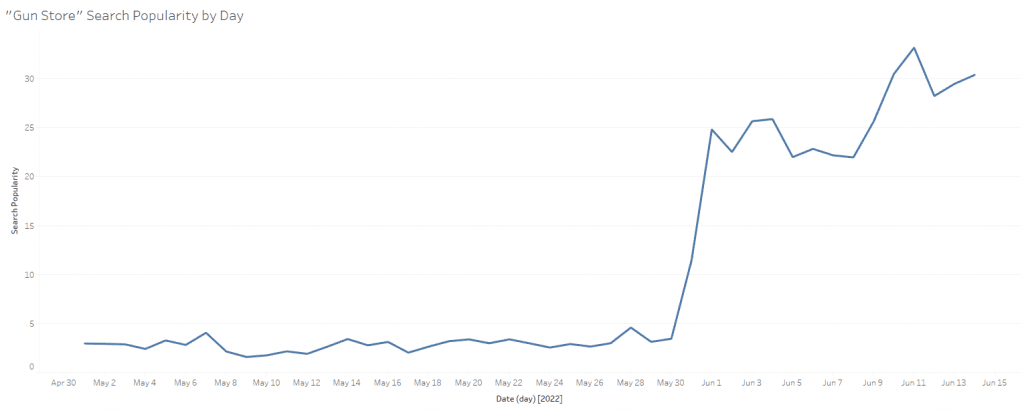
“Gun Store” searches before the shooting hovered at about 18,000 weekly searches. Immediately after the shooting, that figure spiked to nearly 80,000 searches per week, dropping off quickly, but still maintaining search volumes of 35,000-50,000 weekly searches since.

Daily Search Volume for “Gun Store”
“Buy a Gun” searches before the shooting hovered at about 52,000 weekly searches. Immediately after the shooting, that figure spiked to 74,000 searches per week in the week after the shooting, and maintaining significant or even growing slightly since.

Searches by Geography Over Time
The gif below loops from May 10 – June 14, 2022, going from all blue (low volume of searches) to bright red(high volume of searches) over time.
Geography breakdowns are by DMA(designated market area), which are essentially groups of counties that represent specific markets.

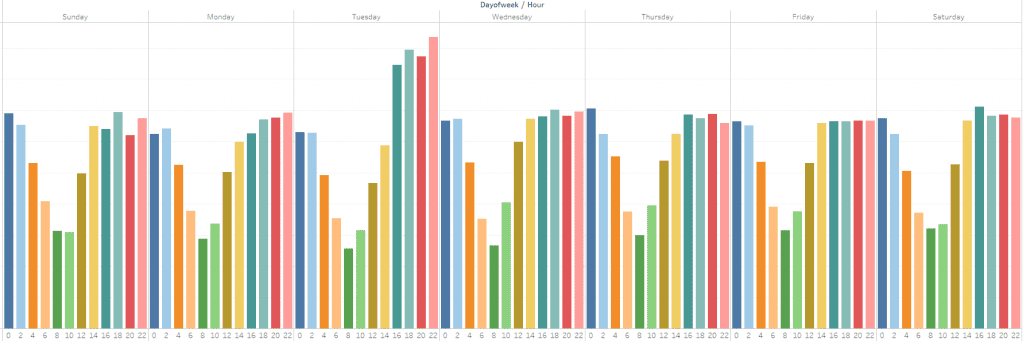
Searches by Hour of the Day
Taking a look at searches by day of week and hour, some additional insights emerge. Tuesday evenings were especially popular times for considering purchasing a gun. Given the shooting was on a Tuesday, this is likely the reason for the spike we see, with searchers wasting almost no time at all between the incident and searching a high-intent gun purchase phrase.

** All of the visualizations above are aggregations of hourly data, which provides more robust daily datasets when aggregated vs. the daily data view provided at trends.Google.com. For this reason, the data shown here may not exactly match what you see on trends.Google.com since the web version lacks an hourly view and shows truncated data without pulling hourly. Estimations of search volume changes in real numbers (not Google’s 1-100 score), are from MeetGlipse.com
