A new report from Stanford University revealed that most people meet romantic partners on the internet – the spark in an estimated 39% of relationships. This represents a dramatic increase from 22% in 2009. Dating apps such as Tinder and classic dating platforms such as eharmony are evolving the way future generations will find lifelong romance … or maybe not.
In the United States, marriage and divorce continue to be divisive topics, with varied stances on how people prefer to declare love and end relationships. The digital age has birthed a new way for couples to meet, connect, vet each other, and fall in (and sometimes out of) love.
Younger generations are increasingly moving toward the “slow love” model, where relationships are fueled by time to promote a strong and sound foundation within a partnership. Changing trends such as this reveal a need to examine how couples are approaching modern-day marriage.
We compared the most recent data available from the U.S. Census Bureau with a survey of over 500 married or divorced people to garner some insights into how the everyday American has experienced weddings and divorce proceedings, where marriage and divorce are most common, and what the future may hold for the couples of tomorrow.
Continue reading to find out what marriage and divorce look like in your generation.
Younger Generations Dating Longer, Waiting to Marry
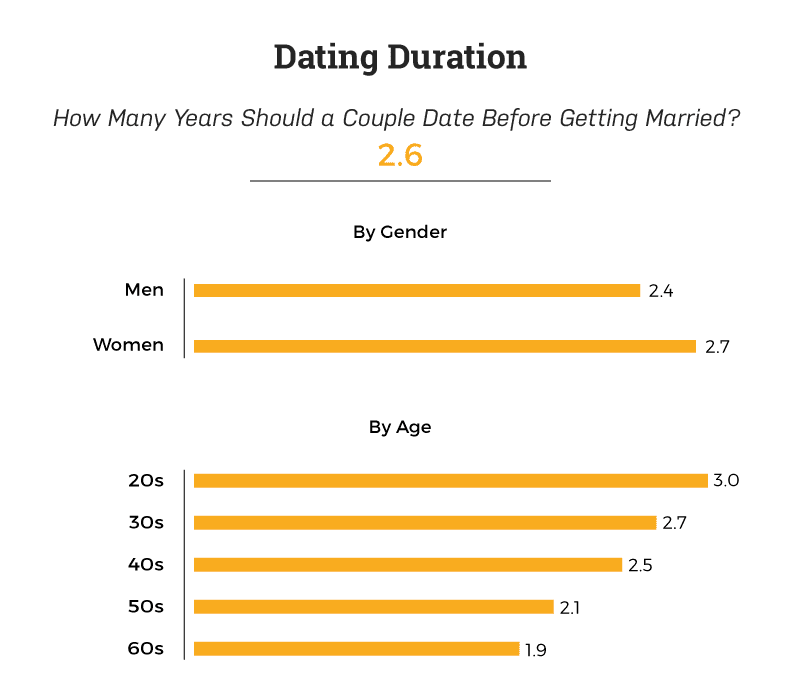
On average, people in their 20s believed three years is enough time to feel ready to commit to marriage. Millennials typically spend far longer dating someone before they are ready to tie the knot, with many preferring to wait for more financial stability prior to getting married. Eliminating debt is a major concern for younger generations struggling with student loan payments and the rising cost of living, so marriage is placed on the back burner, and these individuals seem content with dating their partner longer.
For those without money woes, waiting to get engaged may be a result of wanting to differentiate their relationship from the mistakes of couples in past generations, such as marrying too young or not being certain as to whom they choose to wed.
Economic conditions are currently strong, which usually encourages a rise in birth rates. However, the U.S. is seeing the opposite, as birth rates have dropped to a 30-year low.
Who Supports Later Marriage?
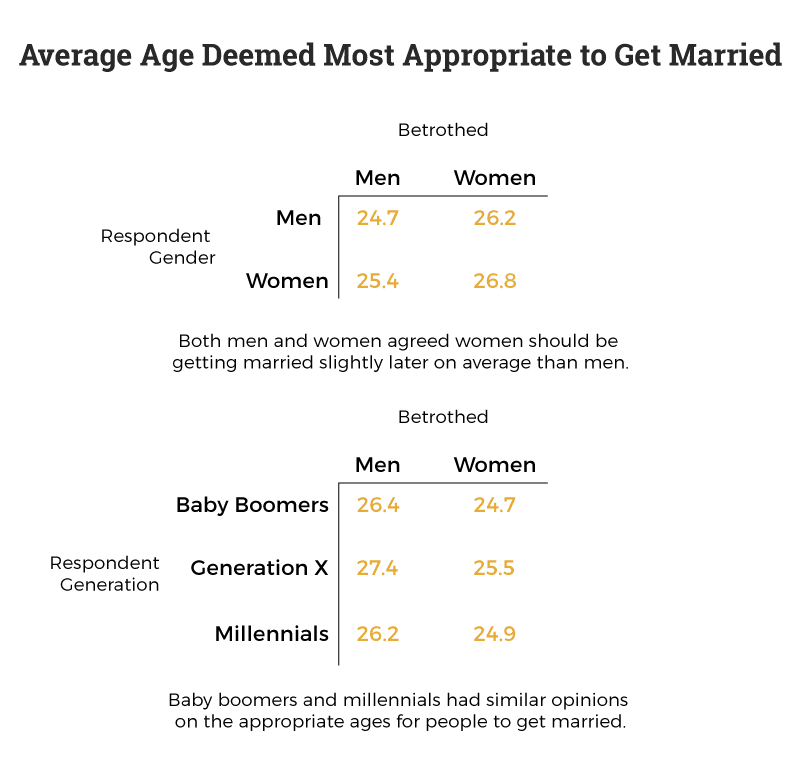
There are all types of stressors that push people into marriage, but men and women are affected relatively equally: We found that general marriage age expectations have stayed the same generation to generation and are fairly similar between men and women.
Culture plays a role in how people view marriage. Across gender, men and women experience varying types of pressure to wed, from men being pushed to buy pricey engagement rings and constant inquires into planning from nosy relatives. One major source of strain comes from pressures to “choose” between a career and a stable home life.
A higher percentage of working women and a chronic issue of people abandoning the search for a work-life balance means trying to juggle relationships and professional obligations. For many, this can be nearly impossible to manage. Those who commit resources and energy to higher education are less likely to marry and are more driven toward career goals.
In this world, it’s possible to retain professional goals that run parallel to a loving relationship, and the expectations for when it’s appropriate to marry are changing to adapt to a growing set of career desires and needs.
Religion’s Influence on Marriage
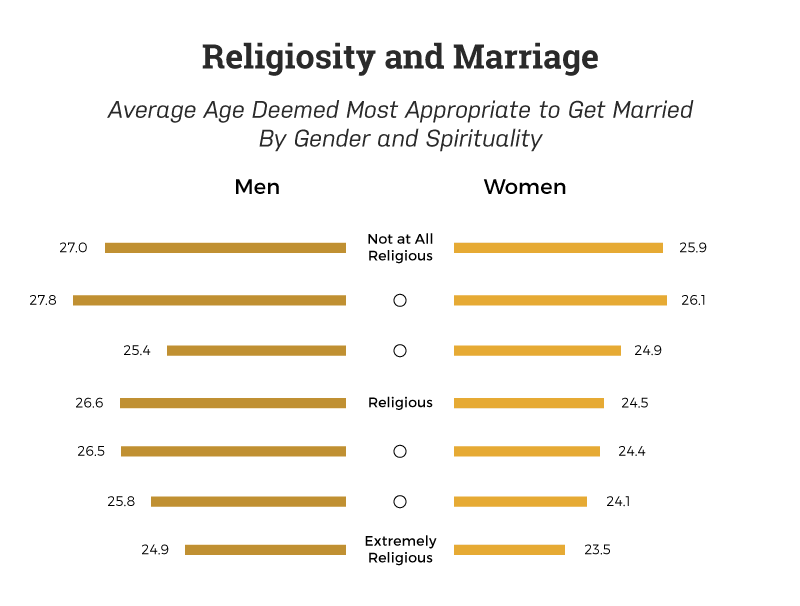
Overall, if someone considered themselves to be very religious, they were more likely to think people should get married at a younger age. Many religious institutions put strong emphasis on the importance of the family unit in someone’s life and romanticising the sanctity of marriage. Youth growing up in a spiritual community may be influenced at the “group-level” to marry younger after being surrounded by like-minded peers who are also predisposed to have marriage on the mind at a younger age.
This occurs more frequently at the collegiate level. In many religious postsecondary schools, the pressure to be engaged by graduation has catalyzed a movement known as “ring by spring,” alienating single people and pushing students into marriages for which they may not be ready.
On the other hand, atheists, agnostics, and those who consider themselves to be nonreligious are more likely to marry at older ages than their religious counterparts.
Real vs. Assumed Costs of Love
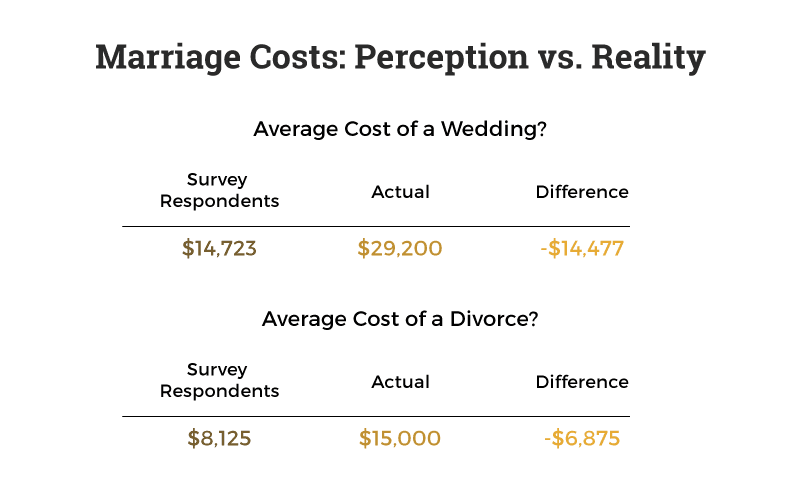
When looking at the real versus assumed costs of love, we found that our survey participants were woefully uninformed about how much people spend on marriage and divorce: Respondents guessed about half the actual cost in both instances.
It’s no secret: From wedding planners, centerpieces, venue rentals, food, invitations, the wedding dress, and everything in between, getting married can be an expensive and drawn-out process. They say the wedding day goes by so fast that it’s hard even to get a piece of cake, but that might be due less to wedding bliss and more to a blackout induced by the high financial cost that some couples (and their families) choose to take on.
Not only are weddings costly for the couple and their families who foot the bill, but they also are expensive to attend, with some guests admitting to forking over $1,000 to attend destination weddings. In many instances, this places an undue burden on friends and family who may not be able to afford the travel or accommodations.
There is even research suggesting that big-budget weddings and expensive engagement rings are more frequently associated with couples who divorce, so being frugal may save a marriage in the long run.
Marriage Rate Rising Despite Public Perception
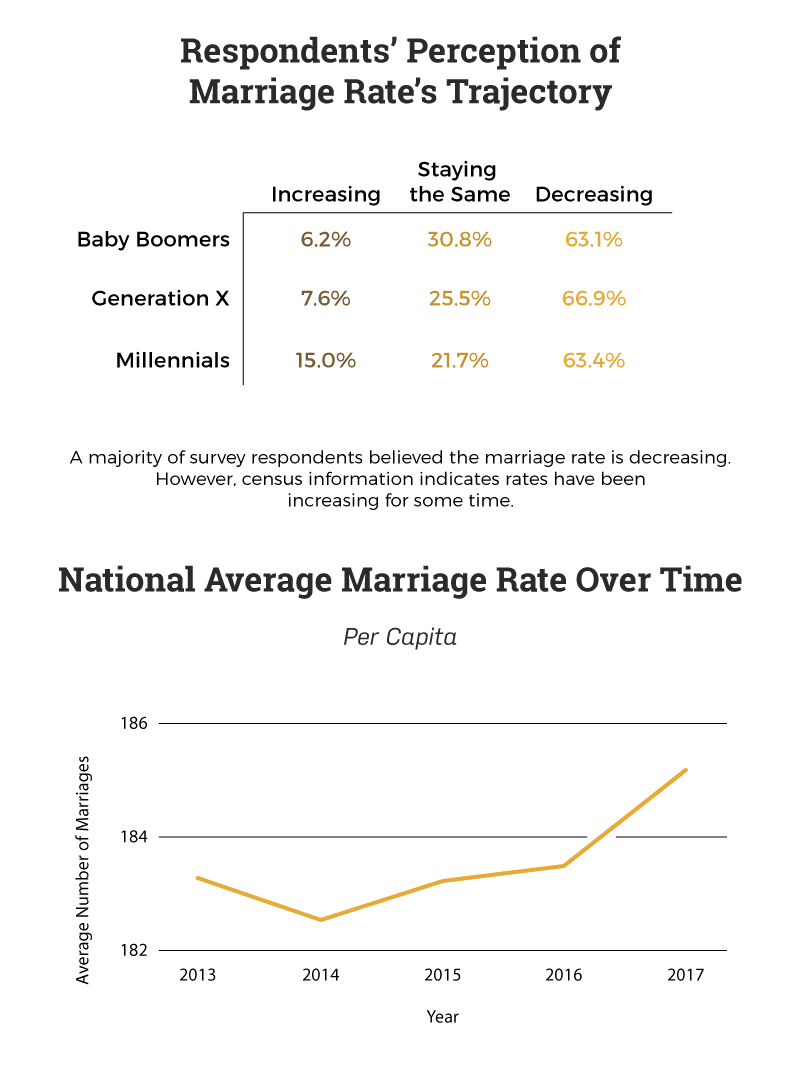
Millennials were the most likely generation to say that the marriage rate was increasing, but that still amounts to only 15% of this group. Overwhelmingly, participants believed the marriage rate is decreasing. However, when compared to population totals, it has increased steadily since 2014.
Thanks to longer lifespans and fewer widowed adults, marriage rates are increasing among older generations. The steady uptick in the chart above might be compensated by baby boomers who are marrying well into their retirement. Conversely, millennials are less likely than previous generations to be married by this point in their lives, possibly contributing to the perceived drop in marriage rates among survey respondents. So if they are not marrying, what does the typical millennial’s relationship look like?
The answer could be explained by increased cohabitation among unmarried couples. According to census data, the number of unmarried couples across all age groups who live together has risen to 7% of the total U.S. adult population, rising from 6 million in 1996 to 17 million in 2017. Cohabitation is appealing to many unwed couples who value a shared living space and would prefer to “test the waters” before getting married.
Americans Think Divorce Rates Are Up Despite Steadily Decreasing
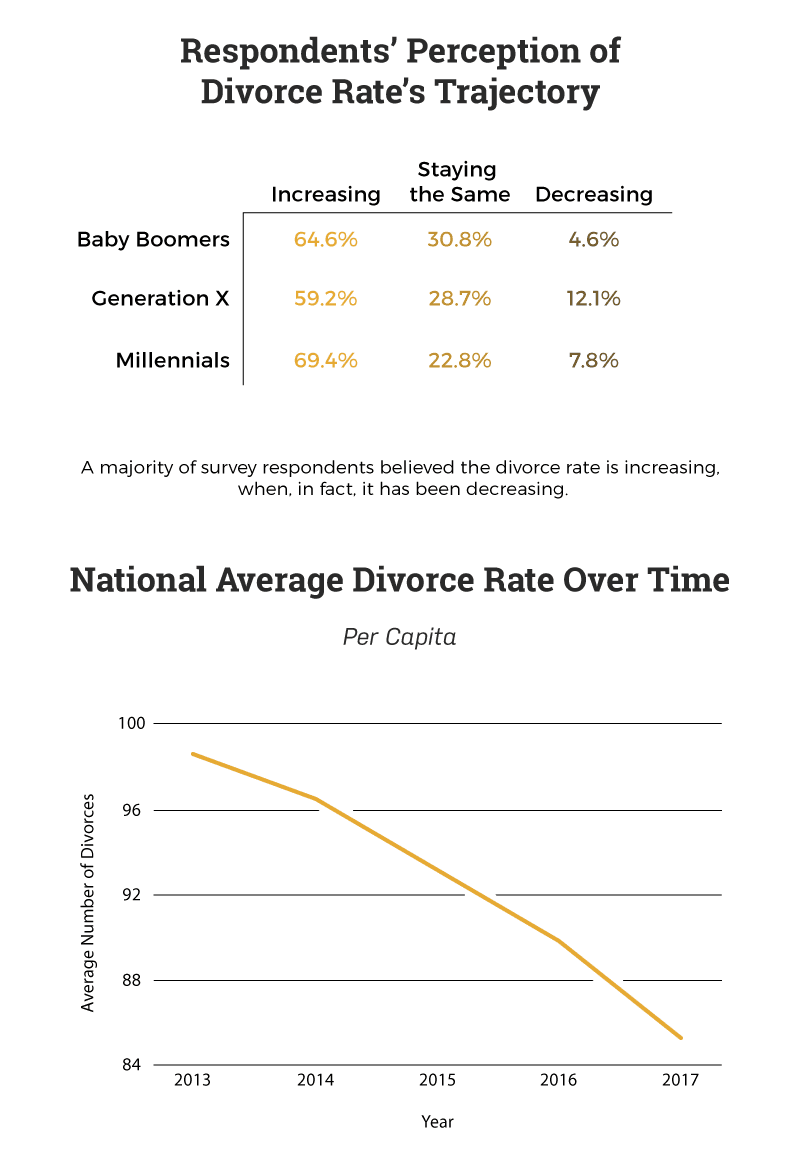
The majority of respondents believed divorce rates are increasing; however, this is not necessarily true. Although younger generations are marrying less often and are more likely to cohabitate while dating, they are also partially responsible for a sharp decrease in the U.S. divorce rate, an 18% drop from 2008 to 2016. As millennials are more particular in their relationships and enjoy longer dating relationships, this is leading to happier relationships and less divorce.
We’ve observed that our survey respondents’ perceptions don’t line up with trends, indicating that rumors about marriage and divorce may stem from outdated statistics. In fact, the statistic proclaiming “half of all marriages end in divorce” is prevalent in the public discourse even though that myth was debunked years ago.
Divorce, Remarriage: By the Numbers
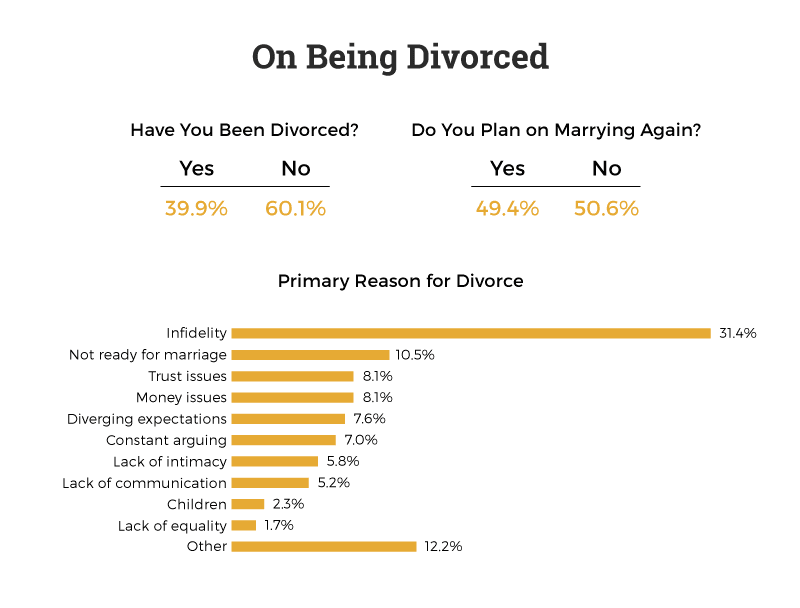
Divorce can be a painful process as sensitive memories are dug up, and old wounds are torn open, all with lawyers present. However, some couples split amicably and can easily move on. No matter the circumstances, though, divorce doesn’t mean someone is ready to give up on finding love.
While around 40% of our survey takers were divorced, almost half were willing to marry again. These days, divorced people are inspired to reclaim their single life in style, organizing a trendy divorce party to commemorate the life change.
The circumstances that lead to a divorce may vary, but infidelity claimed more couples in our survey than any other cause. Cheating can certainly create a rift between partners, but it’s not likely to be the sole cause for two people splitting up. Infidelity can be the result of other issues, such as poor communication or intimacy problems.
UT, AK Have the Highest Marriage Rates; NJ, RI, CT Show the Lowest
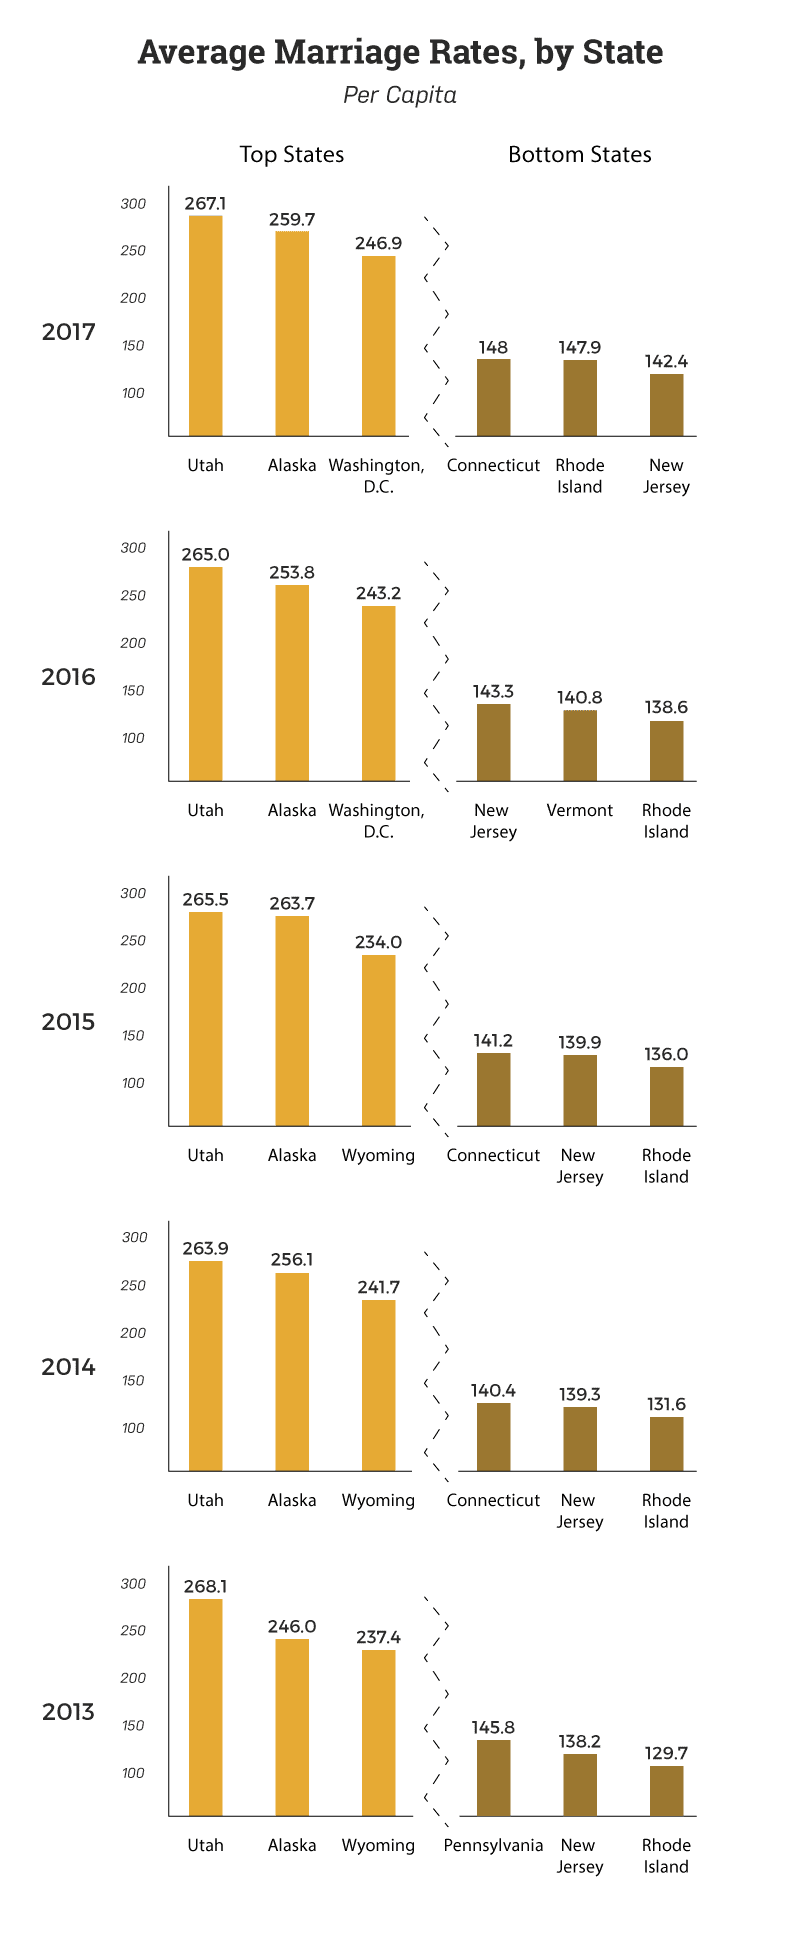
Over the past half-decade, Utah and Alaska led the nation in marriage rates compared to the overall population. On the other hand, Northeastern states, such as Rhode Island and New Jersey, were less likely to have married couples.
Two factors may have led to Utah’s domination in this category: the Mormon population’s influence and low marriage consent age. In regards to the latter, residents and legislators have called for an end to the state’s current policy, which may put 15-, 16-, and 17-year-olds at risk of entering abusive relationships or falling victim to predatory behavior. Alaska faces a similar situation, as the marriage consent age is even younger at 14.
When looking to religious influence, members of the Church of Jesus Christ of Latter-day Saints are more likely to be married, compared to other (even religious) groups.
Alaska’s high marriage rate can also possibly be explained by the relatively low cost of weddings in the state. Couples are far less likely to have an expensive wedding, where the typical ceremony costs $15,000 less than the national average. With less financial pressure, couples may be more likely to stay together and not quarrel over debts sustained from a wedding.
AR, OK Lead the Nation in Divorce Rates
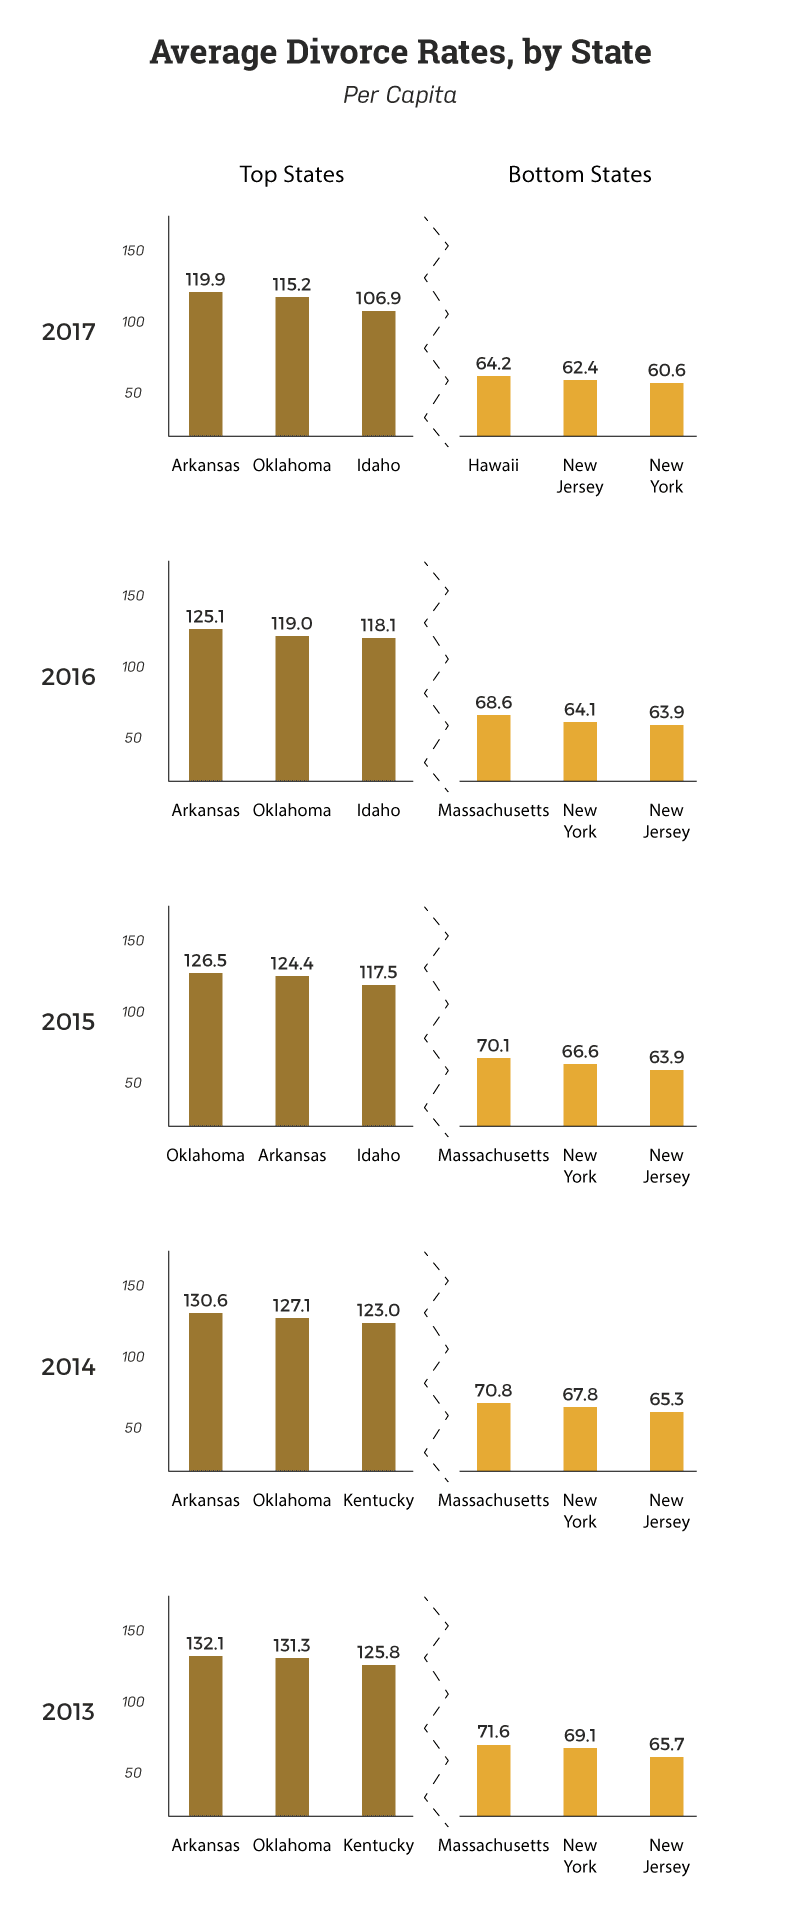
When looking at states with the highest divorce rates, Arkansas and Oklahoma frequently appeared in the top three in the past five years, while New Jersey had the lowest divorce rate and marriage rate across all U.S.
In Oklahoma, high poverty levels and added stress due to money concerns are major issues that may contribute to divorce. At the same time, Arkansas can be characterized by lower-than-average marriage rates, higher divorce rates, and lower incomes overall.
Marriage and Divorce: Takeaways for the Future
Younger generations are actively trying to avoid the mistakes they feel older generations, such as their parents, made in their relationships. They view relationships with more intention and spend more time nurturing their partnerships to ensure compatibility. Additionally, financial stability is a huge influence on long-term relationships, and it plays a role in the success of many couples.
Methodology/Limitations
Conclusions are based on a survey of 512 respondents. Additional marriage and divorce information was gathered from the U.S. Census Bureau, 2013-2017 American Community Survey.
Fair Use Statement
This information allows us to understand how society shows love and expects love to be returned, so share this data with loved ones, partners, and friends. Please cite us when mentioning our study and share only for noncommercial purposes.
