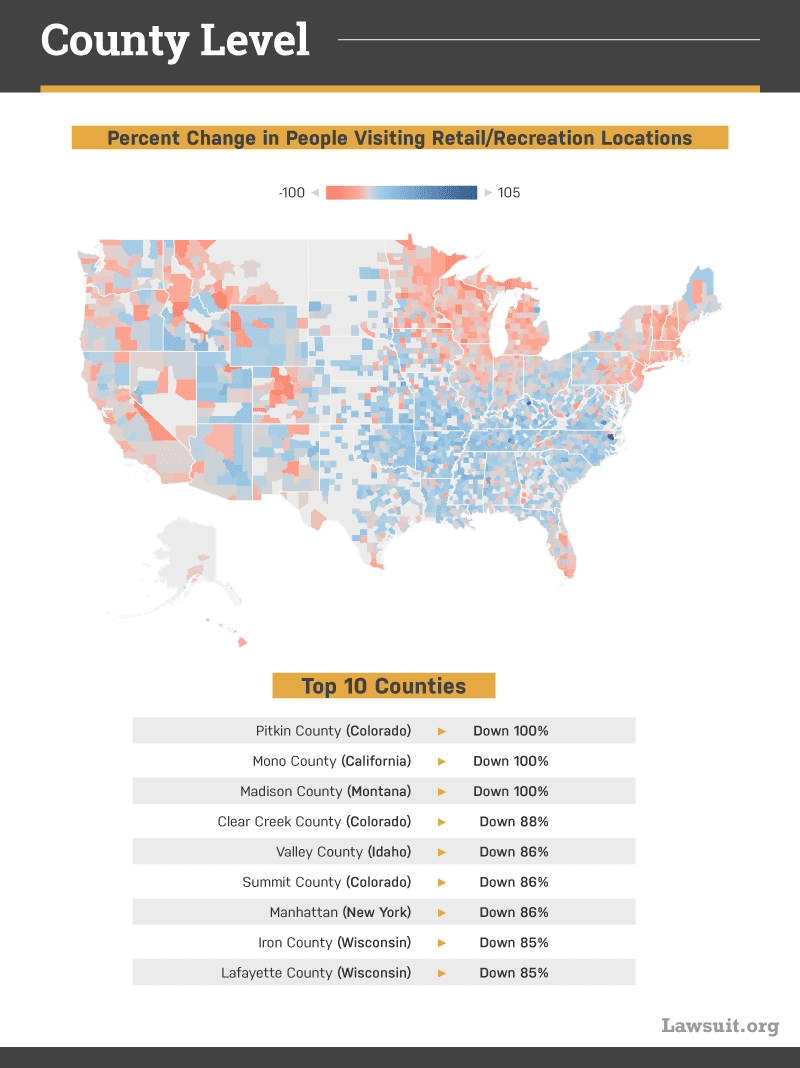
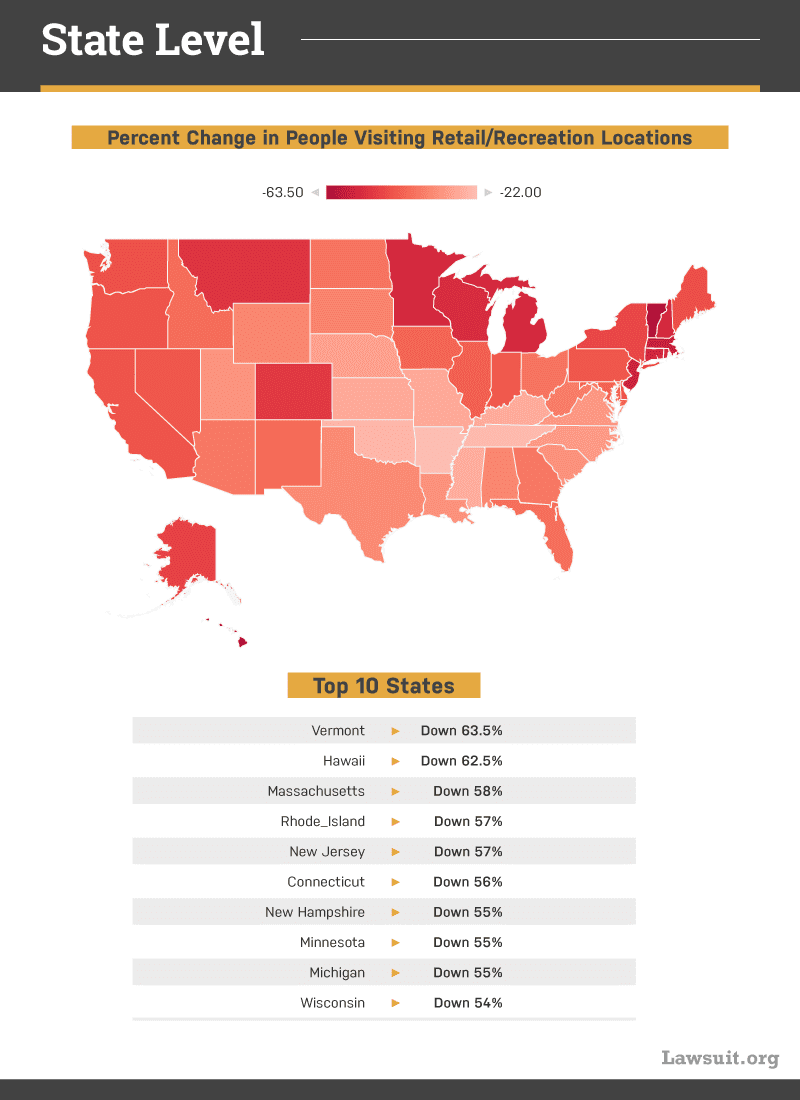
Using this script, we obtained regional data from Google’s COVID-19 Community Mobility Reports in order to map the change in people visiting retail/recreation places.
Google’s mobility report looked at phone tracking data from the day of February 5th, 2020 then compared it to the day of March 31st, 2020 in order to examine percentage change. Using that percentage change data we mapped it by county and state in the visualizations to see which areas were affected the most.
Google’s COVID-19 Community Mobility Reports allows us to see how a community is moving around during this time period. Google obtains insights in these reports using aggregated, anonymized sets of data from users who have turned on the Location History setting on the cellular devices.
County Level Insights

Interactive County Map
Top 10 Counties
These are the counties with the highest percentage change in people visiting retail/recreation locations.
- Pitkin County (Colorado) – down 100%
- Mono County (California) – down 100%
- Madison County (Montana) – down 100%
- Clear Creek County (Colorado) – down 88%
- Valley County (Idaho) – down 86%
- Summit County (Colorado) – down 86%
- Manhattan (New York) – down 86%
- Iron County (Wisconsin) – down 85%
- Lafayette County (Wisconsin) – down 85%
Full List of County Changes
You can view a full list of U.S. counties and their percentage change in people visiting retail and recreation locations during the conronavirus pandemic.
State Level Insights

Top 10 States
These are the states with the highest percentage change in people visiting retail/recreation locations.
- Vermont – down 63.5%
- Hawaii – down 62.5%
- Massachusetts – down 58%
- Rhode_Island – down 57%
- New Jersey – down 57%
- Connecticut – down 56%
- New Hampshire – down 55%
- Minnesota – down 55%
- Michigan – down 55%
- Wisconsin – down 54%
Full List of State Changes
Below you can view a full list of U.S. states and their percentage change in people visiting retail and recreation locations during the COVID-19 pandemic.
| State | Median Retail Percent Change |
| Vermont | -63.5 |
| Hawaii | -62.5 |
| Massachusetts | -58 |
| Rhode Island | -57 |
| New Jersey | -57 |
| Connecticut | -56 |
| New Hampshire | -55 |
| Minnesota | -55 |
| Michigan | -55 |
| Wisconsin | -54 |
| Montana | -52 |
| Colorado | -51 |
| Alaska | -49 |
| New_York | -48 |
| Maine | -46.5 |
| Washington | -46 |
| Delaware | -46 |
| Oregon | -45.5 |
| California | -45.5 |
| Pennsylvania | -45 |
| Nevada | -45 |
| Indiana | -44.5 |
| Illinois | -43 |
| Maryland | -42.5 |
| Iowa | -42 |
| New_Mexico | -41 |
| Idaho | -40.5 |
| Florida | -40 |
| Ohio | -39 |
| North_Dakota | -39 |
| Georgia | -38 |
| Arizona | -38 |
| West_Virginia | -37 |
| South_Dakota | -35.5 |
| Wyoming | -35 |
| Alabama | -35 |
| Texas | -34 |
| South_Carolina | -32.5 |
| Louisiana | -32.5 |
| Utah | -32 |
| Virginia | -31 |
| North_Carolina | -30.5 |
| Nebraska | -29 |
| Missouri | -27 |
| Kansas | -27 |
| Kentucky | -26.5 |
| Mississippi | -26 |
| Oklahoma | -24 |
| Tennessee | -23 |
| Arkansas | -22 |
Visualization Tools
- Data: COVID-19 Community Mobility Reports
- Data collection: Daniel Tsvetkov’s scrape_google_mobility
- Map: Tableau.com
